Energy Efficient VoIP systems

Data Centres are the concentrated processing units for the amazing Internet that is driving the technological innovation of our generation and has become the backbone of our global economy. DataCentres not only process , store and carry textual data rather a vast amount of computing is for multimedia content which could range from social media to, video streaming or VoIP calls. In this article let us analyze the energy effiiciency , carbon footprint and scope of improvements for a VoIP related data centre which hosts SIP and related RTC technology signalling and media servers and process CDRs and/or media files for playback or recordings.

Just like a regular IT datacentre , storage, computing power and network capacity define the usage of the server.Also unobstructed electricty of of paramount importance as any blackout could drop ongoing calls and lead to loss of revenue for the service provider not to forget the loss caused to parties engaged in call.

Increasing Power consumption by telecom Sector over the years
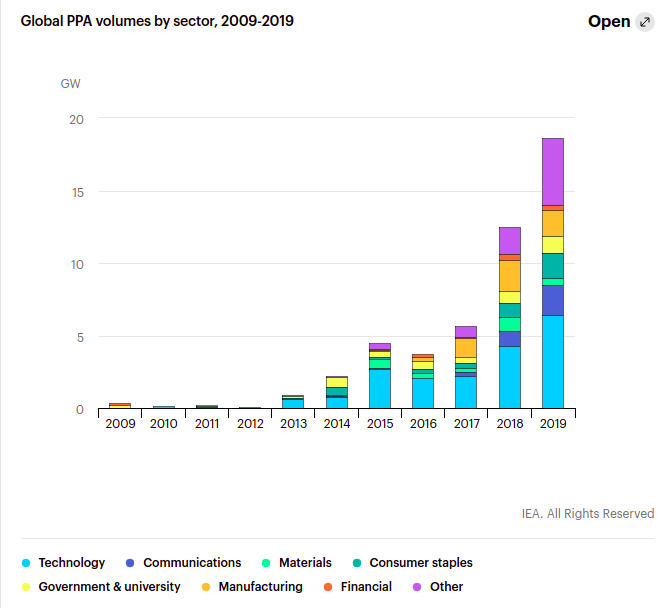
Global PPA(power purchase agreements) volumes by sector, 2009-2019, IEA, Global PPA volumes by sector, 2009-2019, IEA, Paris https://www.iea.org/data-and-statistics/charts/global-ppa-volumes-by-sector-2009-2019
source : CDP The 3% solution 2013 [19]

Typical VoIP Setup : Whether a cloud Infrstrcture provider of a hosted data centre , an aproximate number of 7 servers is required even for SME ( small to medium enterprises ) communication system and VoIP systems

  • 2 signalling servers primary and standby for HA ,
  • 2 media server for MCU of media bridges or IVR playback etc ,
  • 1 for CDR , logs or call analytics , stats and other supplementary operation
  • 1 for dev or engineering team .
  • 1 edge server could be API server or a gateway or laodbalancer.
Sample voIP system

VoIP solutions are more energy expensive, unless aggressive power saving schemes are in place

Comparison of energy efficiency in PSTN and VoIP systems [14]

While PSTN and other hybrid scenarios relied on audio only communication the embedded systems involved took great pain to make then energy efficient which is not really the case with all digital and software based VoIP.

Power Consumption

Mobile phone :  Typical smartphone with 4,000mAh ( 4 Ah) battery that gets 1 full cycle of usage a day. Daily consumption =4Ah*3.7V=14.8 Wh

Laptop : With  14–15″ screen, a laptop can draw 60 watts power in active use depending on model. Runing 8 hours a day can be 60 * 8 = 480 Wh ( 0.480 kWh) energy consumed in a day.

Desktop PC : Runing at 50-60 Hz frequency , can upto draw 200 W power in active use. For 8 hours energy usage 200 * 8 = 1600 Wh ( 1.6 kWh ) energy a day.

Server : Even though servers are virtual to the request maker , they caters to the request on the other end of the internet.

ServerPurposeServer CPU consumptionClientsClient CPU consumption
ApplicationHosts an application, which can be run through a web browser or customized client software.mediumAny network device with access.low
ComputingMakes available CPU and memory to the client. This type of server might be a supercomputer or mainframe.highAny networked computer that requires more CPU power and RAM to complete an activity.medium
DatabaseMaintains and provides access to any database.lowAny form of software that requires access to structured data.low
FileMakes available shared files and folders across a network.mediumAny client that needs access to shared resources.low
GameProvisions a multiplayer game environment.highPersonal computers, tablets, smartphones, or game consoles.high
MailHosts your email and makes it available across the network.mediumUser of email applications.low
MediaEnables media streaming of digital video or audio over a network.highWeb and mobile applications.high
PrintShares printers over a network.lowAny device that needs to print.low
WebHosts webpages either on the internet or on private internal networks.mediumAny device with a browser.medium
CPU consumption of various server types and their clients

Typically runing on 850 Wh ( 0.850 kwh ) of energy in an hour and since server are usually up 24*7 that totals to

0.850 * 24 = 20.4 kWh a day [2].

VoIP System ( 7 VM’s) : For a setup of 7 VM’s ( could on a the same PM), total energy consumed in a day

20.4 * 7 = 142.8 kWh.

Data centre: The data centre building consists of the infrastructure to support the servers, disks and networking equipment it contains. However, for simplicity, I will only use the consumption of servers and ignore the cooling units, networking, backup batteries charging, generators, lightning, fire suppression, maintenance etc.

High tier DC can have 100 Megawatts of capacity having each rack was using 25 kW of power in a 52U Rack. 100,000 kW / 25 kW = 4,000 racks * 52(U) = 208000 1U servers. This number scales down depending on how much energy each server uses and idle servers.

Total energy 100,000 kW * 24 hours = 2400000 kWh

Carbon Footprint

Carbon footprint in the context of this article refers to the amount of greenhouse gas ( consisting majorly of Co2) caused by electricity consumption. The unit is carbon emission equivalent of the total amount of electricity consumed kg CO2 per kWh.

In doing this calculation I have assumed 0.233 kg CO2 per kWh which could be less or more depending on the generation profile of the electricity provider as well as the heat produced by the machine.

Laptop: Aside from the production which could be 61.4 kg (135.5 lbs) of Co2, a 60W laptop will produce 0.112 kg co2 eq per day.

Desktop PC: Aside from production cost and heating, the GWG and co2 eq emission from running a desktop for a day ( 8 hours) produces 1.6* 0.233 = 0.3728 kg CO2 per kWh

Server : 20.4 * 0.233 = 4.7532 kg CO2 per kWh per day .

VoIP System ( 7 VM’s): Again ignoring the GWG emission of associated components, 142.8 * 0.233 = 33.2724 kg CO2 per kWh per day. It is to be noted that DC’s ( datacentres) use the term PUE ( Power Usage Effectiveness) to showcase their energy efficiency and energy efficiency certification uses the same in ratings.

Data centre: electrical carbon footprint( approximate calculation not counting the cooling, infra maintenance, lightning and possibly idle servers in datacentre) is 2400000 * 0.233 = 559200 kg CO2 per kWh per day

It is to be noted that a common figure should not be extrapolated like this to derive carbon emission. The emission depends on the fuel mix of the electricity generation as well as the life cycle assessment (LCA) of carbon equivalent emission. Countries with heavy reliance on renewables have lower co2 footprint per kWh ~ 0.013 kg co2 per kWh Sweden while others may have higher such as 0.819 kg CO2 per kWh Estonia [1].

Flatten the Curve from Tech and Internet usage

Rack servers tend to be the main perpetrators of wasting energy and represent the largest portion of the IT
energy load in a typical data center.

A decade ago, small enterprise IT facilities were quick to create data centres for hosting applications from hospitals, banks, insurance companies. While some of these is likely to have been upgrade to shared server instances runing on IaaS providers, most of them are still serving traffic or stays there for the lack of effort to upgrade.

With the advancement in p2p technlogies such as dApps , bitcoion network , p2p webrtc streaming , more edge computed ML continue to create disruptions in existing trend , most likely to result in in many fold increase in consumption.

According to the Cambridge Center for Alternative Finance (CCAF), Bitcoin currently consumes around 110 Terawatt Hours per year — 0.55% of global electricity production

Harward Business Review [12]

“the emissions generated by watching 30 minutes of Netflix (1.6 kg of CO2) is the same as driving almost four miles.” 

EnergyInnovation [13]

Cloud Computing and Energy efficiency

Cloud computing ( SaaS, PaaS , IaaS and also CPaaS) minimize power consumption and consequently IT costs via virtualization, clustering and dynamic configuration.

With cloud infrastrcture vendors such as Amazon , Google , microsoft .. and their adoption of energy efficiency computing and credible transparency has alleviated some of the stress that could have been made if onsite self – hosted data centres were used as often in mainstream as a decade ago.

Even as cloud providers gives on -demand access to shared resources in large scale distributed computing , the ease of getting on board has inturn created a surge in cloud hosted online applications consequently high power consumption, more operation costs and higher CO2 emissions.

Components of energy Consumption in Data Centre

As shown CPU, Memory, and Storage incur 45% of the costs and consume 26% of the total energy , however power distribution and colling cost 25% but consumer >50% of total energy.

Energy forcast for Data Centres

As reported by nature [3] the widely cited forcasts suggested thte total electrcity demand of ICT ( Informatioin and Communication technology ) will accelerate and while consumer devices such as smart TV , laptops and mobile are becoming energy effcient , the data centres and network devices will demand bigger portions. Reported in 2018 , 200 Twh( terawatt hours) of energy was being consumed by data centers . Although there are no figures for the telecom or specifically IP cloud telephony , the assumption that enormous multimedia data flows in every session is enouogh to assume the figure must be huge.

Energy eficiency in data centres have also been the subject of many papers and studies. Many of the tech advancements and measures have so far been able to keep the growth in energy requirnments by tech sector to a linear/ flat one.

past and projected growth rate of total US data center energy use from 2000 until 2020. It also illustrates how much faster data center energy use would grow if the industry, hypothetically, did not make any further efficiency improvements after 2010. (Source: US Department of Energy, Lawrence Berkeley National Laboratory)

Some noteworthy innovations made in Data centre for energy efficiency include –

  1. Star efficiency requirnments
  • Average server utilization
  • Server power scaling at low utilization
  • Average power draw of hard disk drives
  • Average power draw of network ports
  • Average infrastructure efficiency (i.e., PUE)

PUE = Total Facility power / IT equipment power

Standard 2.0, Good 1.4 , Better 1.1

Low PUE indicates greater efficicny since more power would then be used by It gear . Idealistically 1 should be the perfect score where all power was used only by the IT gears.

2. Optimizing the cooling system which takes a lot of focus is also not touched upon here but can be understood in great detail from very many sources including one here on how google uses AI for cooling its Datacentres [6]

3. Throttle-down drive ,a device that reduces energy consumption on idle processors, so that when a server is running at its typical 20% utilization it is not drawing full power

Energy efficiency is vital to not only productivity and performance but also to carbon neutral tech and economy. There is ample scope to designing energy efficient applications and platfroms. Some approaches are described below:

Energy Efficiency in VoIP Architecture and design

Low Energy consumption not only lowers operating cost but also helps the enviornment by reducing carbon emission.

1.Server Virtualization

By consolidating multiple independant servers to a single underlying physical server helps retain the logical sepration while also maintaining the energy costs and maximizinng utilization . VM’s( Virtual machines) are instances of virtaulized portions on the same server and can be independetly accesed using its own IP and network settings.

To reduce electricity usage in our labs and data centers, we use smart power distribution units to monitor
our lab equipment. We increase server utilization by using virtual machines. Our Cisco Customer
Experience labs use a check-in, check-out system of automation pods to allow lab employees to set up
configurations virtually and then release equipment when they are finished with it.

Cisco 2020 Environment Technical Review [20]

Models to place VMs on PM ( physical machine ) have been proposed by Dong et al[8] , Huang[9]  ,Tian et al [10]

2.Decommissioning old / outdated servers

While this is the most obvious way to increase efficiency , it is also the toughest since legacy applications or a small portion of it may be running on a server that service providers are not keen on updating or updates do not exist and it is past end of life yet somehow still in use. It is important to identify such components. Check if maybe an old glassfish or bea weblogic SIP servlet server needs updating and/or migration !

3.Plan HA ( high availability ) efficiently

Redundant servers take only if at all any , partial loads so they can be activated in full swing when failover happens in other server. With quick load up times and forward looking monitoring , the analyzers can monitor logs for upcoming failure or predictable downtime and infra script can bring up pre designed containers in seconds if not minutes. It isn’t wise to create more than 1 standby server which does no essential work but consumes as much power.

4.Consolidate individual applications on a Server

Map the maximum precitable load and deduce the percentage comsuption with teh same . In view of these figures it is best to consolidate applications servers to be run on a single server . A distributed microservice based architecture can also support consolidation by runing each major application in its own dockerized container. Consolidation ensures that

  • All data can be stored and accessed centrally, which reduces the likelihood of data duplication.
  • while a server is drawing full power , it is also showing relataible utilization.
  • Single point to prevent intrusion , provide security and fix vulnerabilities against malware like ( ransomware , viruses , spyware , trojans)

5.Reduce redundancy

While it is a common practise to store multiple copies of data such as CDR ( call detail records ) and archiev historical logs for later auditing , it is not the most energy efficient way since it ends up wasting stoarge space. It is infact a better approach to skim only the crtical parts and diacard the rest and definetely implement background tasks to compress the older and less referenced logs.

6.Power management

Powering down idle server or putting unused server to sleep is an effective way to reduce operating power but is often ignored by the IT department in view of risking slower performance and failure in call continuity in case a server does go down. However power management leads to potential energy savings and should be weighted accordingly.

7.Common Storage such as Network Attached Storage

Power consumption is roughly linear to the number of storage modules used. Storage redundancy needs to be
right-sized to avoid rapid consumption of avaible storage space , CPU cycles to refer and index them, its associated power consumption [7].

The process of maximizing storage capacity utilization by drawing from a common pool of shared storage on need baisis also allows for flexixbility.

It is sensible to take the data offline thereby reducing clutter on production system and make the existing data quickly retrievable.

8.Sharing other IT resources

Central Processing Units (CPU), disk drives, and memory optimizes electrical usage. Short term load shifting combined with throttling resources up and down as demand dictates improves long term hardware energy efficiency. [7]

Hardware based approaches such as energy star rating, air conditoning , placement of server racks , air flow , cabling etc have not been touched upon in this article they can be read from energystar report here [5] .

9. DMZ / Perimeter network

The perimeter network (also known as DMZ, demilitarized zone, and screened subnet) is a zone where resources and services accessible from outside the organization are available. Often used as barrier between internal secure green zone within company and outside partners / suppliers such as external organization gateways.

  • Load balancers
  • API gateways
  • SBC ( Session Border controllers)
  • Media Gateways

Ways to cut down on CPU consumption in DMZ machines

  1. Scrutinize incoming traffic only , trust outgoing traffic .

2. Use hardware / network firewalls to monitor and block instead of software defined ones . Hardware firewall can be a standalone physical device or form part of another device on your network. Physical devices like routers, for example, already have a built-in firewall. 

Other types of firewalls

  • Application-layer firewalls can be a physical appliance, or software-based, like a plug-in or a filter. These types of firewalls target your applications. For example, they could affect how requests for HTTP connections are inspected across each of your applications.
  • Packet filtering firewalls scrutinize each data packet as it travels through your network. Based on rules you configure, they decide whether to block the specific packet or not. For example firewalls can block SSH/RDP for remote management.
  • Circuit-level firewalls check whether TCP and UDP connections across your network are valid before data is exchanged. For example, this type of firewall might first check whether the source and destination addresses, the user, the time, and date meet certain defined rules.
  • Proxy server firewalls secure the traffic into and out of a network by monitor, filter, and cache data requests to and from the network.

Energy Efficiency in VoIP Applications and algorithms

In theory, energy efficient algorithms would take less processing power , run fewer CPU cycles and consume less memory. For the experiments with WebRTC and SIP VoIP systems CPU performance can be reliable factor to consider for carbon emissions . Here is list of approaches to include energy as of the parameters in programing for RTC applications.

  1. Take advanatge of Multi Core applications

Multi-core processor chips allow simultaneous processing of multiple tasks, which leads to higher efficiency. Same power source and shared cooling leads to better efficiency . It is the same logic which applied to consolidating one power supply for a rach isntead of individual power supply to each servers on rack.

2. Reduce Buffering

Input/Output buffer pile up comuted packets or blocks which will come inot use in near future but may be discarded all together in event of skip or shutdown. For example in case of video on Demand ( VoD) , a buffered video of 1 hour is of not much use if viewer decides to cancel the video session after 10 minutes .

3. Optimize memeory access algorithms

4. Network energy Management to vary as per demand

The newer generations of network equipment pack more throughput per unit of power. There are active energy management measures that can also be applied to reduce energy usage as network demand varies. In a telecoomunication system , almost always a tradeof between power consumption and network performance is made.

  1. Quick switching of speed of the network to match the amount of data that is currently transmitted. A demand following streaming session will maingtain the QoS , avoid imbalance while also reducing power consumption.

2. Avoid sudden burst and peaks and/or align them with energy availaibility .

Metrics

  • computational performance (i.e., computations/second per server),
  • electrical efficiency of computations (i.e., computations per kWh),
  • storage capacity (i.e., TB per drive), and
  • port speeds (i.e., Gb per port)

5. Task Scheduling algorithms

Some recent researched frameworks and models take Co2 emission into prespective , while allocating resources according to queuing model. The most efficient ones not only bring down the carbon footprint but also the high operating cost [11].

Scheduling and monitoring techniques have been applied to achieve a cost effective and power-aware cloud environment by reducing the resource exploitation

6. Centralised operation – RTP topology ( Mesh , MCU and SFU)

Instead of operating many servers at low CPU utilization, at edge of client’s end, combines the processing
power onto fewer servers that operate at higher utilization.

Modern machine learning programs are computationally intensive, and their integration in VoIP systems for tagging , sentiment analysis , voice quality analysis is increasingly adding additional strain already heavy processing of media server in transcoding and multiplexing .

Media Server using SFU ( Selective Forwarding unit) to transmit mediastrem

As an example a SFU client sends one upstream but receives 4 downstreams which reduces the load on server but increases on clients .

7. Distributing workload based on server performance

Aggregating tasks and runing them as Serverless , asynchronous jobs instead of standalone processes is very efficient way to cut down idle runing wastage. Additioally catagorizing server workloads based on server performance can also reduce power consumption by using idle servers efficiently. Thermal aware workload distribution also helps reducing power consumption and consequently electricity consumption in cooling .

8 . Reduce reauthetication and challemge response mechanism when it can be avoided.

There exists multiple modes to authenticate and authorize users and application access to server content

Over the network

  • password based auth ,
  • third party based auth ( Oauth)
  • 2 factors authetication( phone/sms based) ,
  • multi factor auth ( sms / email / other media) ,
  • token auth ( custom USB device/ smart card ) ,
  • biometric auth (physical human charecteristics / scanners ) ,
  • transactional auth ( location , hour of day , browser/ machine type)

Computer recognition authentication

  • CAPTCHA
  • Single sign-on

Authentication protocols

  • Kerbos – Key Distribution Center (KDC) using a Ticker gransting Server ( TGS)
  • TLS/SSL

A callflow involves AAA while creating the session and may require occsional re authetication to reafform the user is intended one. Doing re-authtication too often increases the power consumption and can be countered by caching and timeout mechanism.

Point of presence and handover using Carbon footprint in different demographics

  1. Include Carbon emission from Datacentre in condieration before engaging the server in call path from load balancer gateway

2. Use point of presence ( PoP) for server according to their carbon emission factor in the demography .

Us states carbon emission rate from electricity generation (2018 report ) Source : [16]
UK greenhouse gas reporting source : [17]

Energy Efficiency in WebRTC browser applications and native applications

In a Video conferencing the over browser, WebRTC has emerged as te the default standard . The efficiency of sch webrtc browser based video conferencing web applications can be enhanced in the following ways :

1.Use VoIP Push Notifications to Avoid Persistent Connections

2. Voice Activity detection ( Mute the spectators ) and join with video true , audio false for attendeees

Energy efficiency in VoIP phones

If all eligible VoIP phones sold in the United States were ENERGY STAR certified, the energy cost savings would grow to more than $65 million each year and 1.2 billion pounds of annual greenhouse gas emissions would be prevented, equivalent to the emissions from more than 119,000 vehicles.

Energystart [15]

Low-energy-consuming embedded hardware on most phones keep the average consumption low . A analog phone can consume power between 0.07 W to 9.27 W while a VoIP phone can consume 0.1W to 3.5 W of standby power.

Off mode power is often less than standby power since phone is on low power model during idle hours such as night . According to energy star Sund transmission mechnism also plays a key role and hybrid phones consume more power.

Power allowance (W) for each of the below features of the device:

  • 1.0 watt for Gigabit Ethernet
  • 0.2 watt for Energy Efficiency Ethernet 802.3az compliant Gigabit Ethernet

Additional proxy incentive(W) for the ability to maintain network presence while in a low power mode and intelligently wake when needed

  • 0.3 watt for base capability
  • 0.5 watt for remote wake

Government bodies and groups to track Energy efficiency of Telecom and IP telephony

  • Alliance for Telecommunications Industry Solutions (ATIS)
  • Telecommunications Energy Efficiency Ratio (TEER)
  • measurement method covers all power conversion and power distribution from the front end of the
    system to the data wire plug, including application-specific integrated circuits (ASICs).
  • European Telecommunications Standards Institute (ETSI)
  • International Telecommunication Union (ITU)
  • U.S. Department of Energy (DOE), Environmental Protection Agency (EPA)

External links

Amazon : https://sustainability.aboutamazon.com/environment/sustainable-operations/carbon-footprint

Cisco : https://www.cisco.com/c/dam/m/en_us/about/csr/esg-hub/_pdf/2020_Environment_Technical_Review.pdf

3CX : https://askozia.com/voip/how-can-i-save-energy-with-green-voip-and-my-ip-pbx/

The purpose of the article is to raise awareness about carbon footprint from application programs to archietcture designs techniques to data centres and commuulative performance. It gives a direction to stakeholders (customers , programmers , architects , mangers , … ) to choose less carbon emitting approach whenever possible since every bit counts to help the environment.

References

[1] rensmart.com https://www.rensmart.com/Calculators/KWH-to-CO2

[2] https://www.zdnet.com/article/toolkit-calculate-datacenter-server-power-usage/

[3] nature : https://www.nature.com/articles/d41586-018-06610-y

[4] Center of Expertise for Energy Efficiency in Data Centers at the US Department of Energy’s Lawrence Berkeley National Laboratory in Berkeley, California. https://datacenters.lbl.gov/

[5] energy Star – https://www.energystar.gov/sites/default/files/asset/document/DataCenter-Top12-Brochure-Final.pdf

[6] https://www.blog.google/inside-google/infrastructure/safety-first-ai-autonomous-data-center-cooling-and-industrial-control/

[7] https://www.energy.gov/sites/default/files/2013/10/f3/eedatacenterbestpractices.pdf

[8] Yin K, Wang S, Wang G, Cai Z, Chen Y. Optimizing deployment of VMs in cloud computing environment. In: Proceedings of the 3rd international conference on computer science and network technology. IEEE; 2013. p. 703–06.

[9] Huang W, Li X, Qian Z. An energy efficient virtual machine placement algorithm with balanced resource utilization. In: Proceedings of the seventh IEEE international conference on innovative mobile and internet services in ubiquitous computing; 2013. p. 313–19.

[10] W. Tian, C.S. Yeo, R. Xue, Y. Zhong Power-aware schedulingof real-time virtual machines in cloud data centers considering fixed processing intervalsProc IEEE, 1 (2012), pp. 269-273

[11] H. Chen, X. Zhu, H. Guo, J. Zhu, X. Qin, J. Wu Towards energy-efficient scheduling for real-time tasks under uncertain Cloud computing environmentJ Syst Softw, 99 (2015), pp. 20-35

[12] https://hbr.org/2021/05/how-much-energy-does-bitcoin-actually-consume

[13] https://energyinnovation.org/2020/03/17/how-much-energy-do-data-centers-really-use/

[14] F. Bota, F. Khuhawar, M. Mellia and M. Meo, “Comparison of energy efficiency in PSTN and VoIP systems,” 2012 Third International Conference on Future Systems: Where Energy, Computing and Communication Meet (e-Energy), 2012, pp. 1-4, doi: 10.1145/2208828.2208834. https://citeseerx.ist.psu.edu/viewdoc/download?doi=10.1.1.720.446&rep=rep1&type=pdf

[15] https://www.energystar.gov/products/office_equipment/voice_over_internet_protocol_voip_phone

[16] egrid summary table 2018 for carbon emission rate in Us states : https://www.epa.gov/sites/default/files/2020-01/documents/egrid2018_summary_tables.pdf

[17] UK greenhourse gas reporting – https://www.gov.uk/government/publications/greenhouse-gas-reporting-conversion-factors-2018

[19] http://assets.worldwildlife.org/publications/575/files/original/The_3_Percent_Solution_-_June_10.pdf?1371151781

[20] https://www.cisco.com/c/dam/m/en_us/about/csr/esg-hub/_pdf/2020_Environment_Technical_Review.pdf

[21] It’s Not Easy Being Green by Peter Xiang Gao, Andrew R. Curtis, Bernard Wong, S. Keshav
Cheriton School of Computer Sc https://dl.acm.org/doi/pdf/10.1145/2342356.2342398

TeleMedicine and WebRTC

Anywhere anytime Telemedicine communication tool accessible on any device.  The solution provides a low eight signalling server which drops out as soon as call is connected thus ensuring absolutely private calls without relaying or involving any central server in any call related data or media . This ensure doctor patient details are not processed , stored or recorded by our servers.

The solution enables doctors / nurses / medical practitioners and patients  to do

  • High definition Audio/video calls 
  • End to end encrypted p2p chats 
  • Integration with HMS ( hospital management system ) to fetch history of the patients 
  • Screens sharing to show reports without transferring them as files 
  • Include more concerned people of doctors using Mesh based peer to peer conferencing feature.      

Confidentialty and Privacy

For privacy and security of certain health information only HIPAA (Health Insurance Portability and Accountability Act of 1996) compliant video-conferencing tools can only be used for Telemedicine in US.

Telemedicine scenario Callflow

Calllfow for Attended Call Transfer and 2 way conference in a Telemedicine scenario between Patient , hospital attendant , doctor and a nurse

References :

NLP ( Natural Language Processing ) in VoIP

NLP ( Natural Language Processing ) can be defined as the automatic manipulation of natural languages ( text or audio) using computer algorithms and softwares. As such NLP has great potential in cognitive and artificial intelligence , but also with increasing human to machine interaction and enhancement in Machine learning ,NLP is set to revolutionize the Voice over IP space.

Note : although not obvious but some people confuse Natural language procession with Neurolinguistic pressing which is a science in Psychology.

NLP evolves from linguistics which itself is a study of language along with its semantics , phonetics and gramer. Every language has rules and NLP uses mathematical formulation to understand it. Discrete mathematical formalisms will be discussed later in this article.

Inputs for NLP is usually though conversation, speech, correspondence, reading, print, written composition, dictation, publishing, translation, lip reading, signing etc .

Rule based vs Statistical NLP – In contrast to rule based engines which work on hard preset values using maybe a decision tree , statistical models work in a more probabilistic fashion which produces more reliable results even in unfamiliar scenarios.

Linear classifier vs Convolutional Neural Nets– CNNs are powerful supervised deep learning technique. As opposed to a linear classifier whose decision boundary on feature space is linear function , CNN increases model complexity by adding more layers . tbd-

NLP tasks

Syntax

Grammer induction , lemmitization , morphological segmentation , part of speech tagging , parsing , sentence breaking , stemming , word segmentation , terminology extraction

Semantics

lexical , distributional , machine translation , Named entity recognition ( NER) , natural language understanding and generation, relationship establishment , sentimental analysis , work sense disambiguation , OCR( optical Character recognition) , recognizing textual entailment

Speech

speech recognition , specch segmentation , text to speech , dialogues

Discourse

automatic summarizations , conference resolution , discourse analysis

Key techniques

Out of above its worthy to point out few key techniques

Parts of speech (POS )

A primary tasks in NLP is to extract tokens and sentences, identify parts of speech ( like nouns , verbs , adjectives ) and create parse trees.

POS tagging is the process of marking up a word in a corpus to a corresponding part of a speech tag . By tagging, algorithm builds lemmatizers which are used to reduce a word to its root form.

POS methods significantly differs from Bag-of-words(BOW) methods which disregards semantic relation relationship and only takes into account words and their frequencies. Whereas POS takes context and definition into consideration.

POS tagging techniques include lexical , rule based , probablistic and deep learning methods.

Named entity recognition (NER)

Given a stream of text, determine which items in the text map to proper names, such as people or places, and their types such as person, location, Organization. Example for raw test as below using Spacy.io

“Hello ! My name is Atanai and I work on Solution design and architecture, developed many custom WebRTC and SIP based solutions such as telecom applications, media stream inetgration into IOT,Unified communication-collaboration ,signalling gateways ,SBC etc. I passed out from Anna university with Betch degree in 2011 and currenlty stay in Bangalore India.”

Analysis of NER is

Noun phrases: ['My name', 'Atanai', 'I', 'Solution design', 'architecture', 'many custom', 'WebRTC and SIP based solutions', 'telecom applications', 'media stream integration', 'IOT', 'Unified communication-collaboration', 'signalling gateways', 'I', 'Anna university', 'Betch degree', 'currently stay', 'Bangalore India'] 
Verbs: ['be', 'work', 'develop', 'base', 'signal', 'pass'] 
Atanai PERSON 
WebRTC PRODUCT 
SIP ORG 
IOT ORG 
Betch NORP 
2011 DATE 
Bangalore India LOC

Sentiment Analysis

Understand the overall opinion, feeling, or attitude expressed in given media ( speech , text or video) .

NLP in action

NLP application layout

Steps to obtain insights and relevant information from an unclassified document , raw tex file or speech to text content such as recording from VOIP meeting

step 1 : upload a document which could be an invoice , order , feedback , complaint or any other unstructured raw text

Step 2 : Collect the data from the document

  • use OCR (optical character recognition) for hand written or signed components
  • perform search , index , duplication detection etc
  • can use MNIST database as
  • phrase matching and vocabulary
  • Can use translation APIs to trans late from other languages

Step 3 : Collect meaning-full data

  • perform Part of Speech (POS) tagging and chunking process
  • topic discovery and modelling
  • tokenizations and text classification , obtain domain specific entities from the document
  • can use standard model language to collect relevant frequently used words
  • NER ( Named Entity recognition ) to validate names , places and locations
  • can extract out time and date from mentioned entities
  • build relationship graphs

step 4 : extract sentiments using a trained model

  • utilize Regular Expressions for pattern searching
  • sentiment analysis

General Applications:

Application of NLP find its way into many domains

1.VOIP platforms ,media servers and automatic summarization of conference / meetings like “Minutes of Meetings” to highlight the key takeaways from a VOIP session

2. Automatic essay assessment and scripting in education setting alike.

3. Image annotation using metadata describing digital images for categorizations and easy retrieval based on keywords.

4. Spam filtering

5. Building automatic assistants and chatbots with Speech Recognition and using auto suggest with sentence completion ( Siri , Alexa , google voice etc )

6. Social Media Analytics , to track sentiments about topic , figure out influencers such as for movie or restaurant reviews .

NLP in VOIP system

To know more about sound waves go here which describes fundamental characteristics of analog waves . To know more about analog wave modulation go here , this describes how waves are modulated such as frequency , phase , amplitude etc to hold information for propagation . click here to know more about digital wave modulation such as amplitude , frequency , phase shift keying etc . This section build on top of audio streams captured or live .

Based on NLP and trained models on extracted features ,an unknown audio wave can be classified and possibly identified.

Replacing auto attendants with IVR

tbd–

Ref :

Tools ref:

VOIP Call Metric Monitoring and MOS ( Mean Opinion Score)


Metrics for monitoring a VOIP call can be obtained from any node in media path of the call flow . Essentially used for analysis via calculation and aggregation , and sometimes used for realtime performance tracking and rectification too.

VoIP call quality metrics

RTP provides real time media stream, payload type identification, packet sequencing and timestamping headers.

sequence num : tracks incremental succession of incoming packets by sendor and tracls out of order delivery.

timestamp : used by the receiver to play back the received samples at appropriate time and interval. 

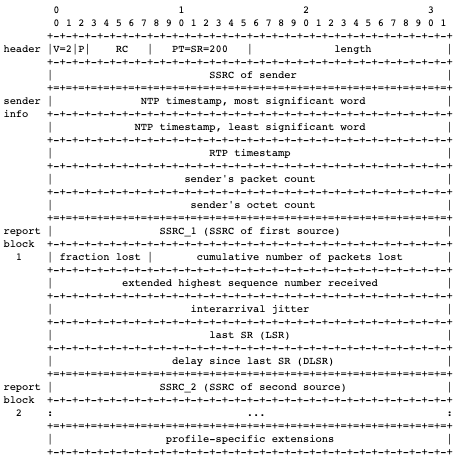
source : wikipedia RTP

Note that all Synchronization source (SSRC) identifiers fields denote the synchronization source within the RTP session such as both legs of a call session

  • leg A between Caller and RTP proxy,
  • leg B between RTPproxy and Callee

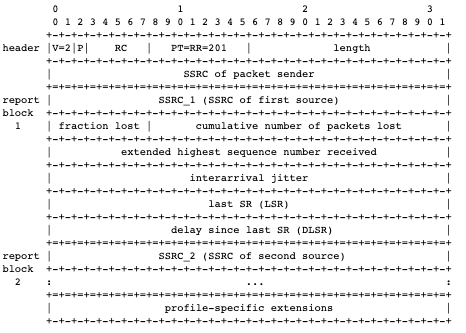
RTCP provides detailed monitoring of stream to participants in an ongoing session with statistical data and enhanced metrices for QoS ( quality of service ) and synchronisation using it SR ( senders Report ) and RR ( Receivers report) segments .

  • Packet loss rate
  • Packet discard rate
  • round trip delay
  • R factor which is voice quality carried over RTP ssession
  • mos lq for listening quality and mos cq for conversation qualityy
  • jitter buffer current delay , maximum delay
RTCP – SR
RTCP – RR

Certain aspects of RTP media and its RTCP metrics were discussed before you can read more about RTCP and RTCP / AVPF here RealTime Transport protocol (RTP) and RTP control protocol (RTCP )

Other call realted factors which are not specifically part of RTCP but provide information about call quality are

  • signal level
  • noise level
  • gap density, gap threshold
  • Burst density
  • residual echo return loss

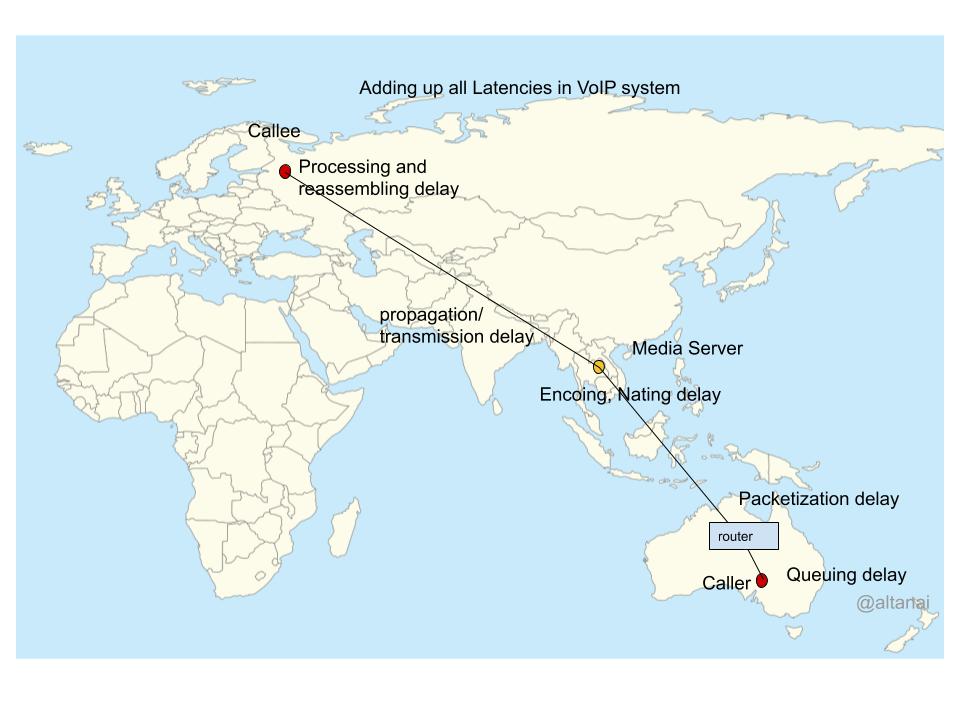
Delays like following also play a signaificant influence in VoIP Quality

  • end system delay
  • Paketzation Delay
  • Setup delay ( auth, TLS handshake, accessing mic/camera stream ..)
  • Queing Delay
  • Serialization dleay
  • Network latency
  • End device processing delay such as CPU of the end device

It should be noted that in addition to these values which can be caluvulated algorithimically and with high precsiion , there are more subjective quality parameters which can be only evaluted manually ( ie witha person listening on both ends ) such as

  • Robot voice
  • Perceptible sound but annoying speech quality

Rating Factor (R-Factor) and Mean Opinion Score (MOS)

Rating Factor (R-Factor) and Mean Opinion Score (MOS) are two commonly-used measurements of overall VoIP call quality.

What is R-Factor ?

This is a value derived from metrics such as latency, jitter, and packet loss per ITU‑T Recommendation G.107. It assess the quality-of-experience for VoIP calls on your network. Typical scores range from 50 (bad) to 90 (excellent).

  • R factor of 90 , Mos is 4.3 ( Excellent )
  • R factor 50 , Mos is 2.6 ( Bad)

What is MOS?

MOS is derived from the R-Factor per ITU‑T Recommendation G.10 which measures VoIP call quality. PacketShaper measures MOS using a scale of 10-50. To convert to a standard MOS score (which uses a scale of 1-5), divide the PacketShaper MOS value by 10.

MOS ( Mean Opinion Score )

MOS is terminology for audio, video and audiovisual quality expressions as per ITU-T P.800.1. It refers to listening, talking or conversational quality, whether they originate from subjective or objective models.

  • Very Good: 4.3-5.0
  • Bad: 3.1-3.6
  • Not Recommenced : 2.6-3.1
  • Very Bad: 1.0-2.6

It provides provisions for identifiers regarding the audio bandwidth, the type of interface (electrical or acoustical) and the video resolution too, such as

  • MOS-AVQE for audiovisual quality
  • MOS-CQE is for estimated conversational quality
  • MOS-LQE for listening quality
  • MOS-TQE is used for talking quality
  • MOS-VQE depicts video quality

For Audio Signal Speech Quality/ AV
– N denotes audio signals upto narrow-band (300-3400 Hz)
– W is for audio signals upto wideband (50-7000 Hz)
– S for upto super-wideband (20-14000 Hz)
– F is obtained for fullband (10-20000 Hz)

For Listening quality LQO

  • electrical measurement : done at electrical interfaces only. In order to predict the listening quality as perceived by the user, assumptions for the terminals are made in terms of intermediate reference system (IRS) or corrected IRS frequency response. A sealed condition between the handset receiver and the user’s ear is assumed.
  • acoustical measurement : done at acoustical interfaces. In order to predict the listening quality as perceived by the user, this measurement includes the actual telephone set products provided by the manufacturer or vendor. In combination with the choice of the acoustical receiver in the laboratory test , there will be a more or less leaky condition between the handset’s receiver and the artificial ear.

Conversational Quality / CQ

Arithmetic mean value of subjective judgments on a 5-point ACR quality scale, is calculated.

Talking Quality / TQ

This describes the quality of a telephone call as it is perceived by the talking party only. Factors affecting TQ include echo signal , background noise , double talk etc. It is calculated based on the arithmetic mean value of judgments on a 5-point ACR quality scale.

Video Quality / VQ

To account for differentiation in perceived quality for mobile and fixed devices and to allow for proper handling of different use-cases as
– M for mobile screen such as a smartphone or tablet (approximately 25 cm or less)
– T for PC/TV monitors
It is calculated based on the arithmetic mean value of subjective judgments, typically on a 5-point quality scale

Audio Visual Quality / AVQ

Refers to quality of audio visual stream under corresponding networking conditions. It is also calculated based on the arithmetic mean value of judgments on a 5-point ACR quality scale.

Other parameters also contributing to VoIP metric Analysis

Latency

Latency is primarily is the time required for packets to travel from one end to another, in milliseconds. For example, if the sum of measured latency is 800 ms and the number of latency samples is 20, then the average latency is 40 ms. The header of the RTP packets carry timestamps which later can also be used to calculate round-trip time.

Medium of propagation

  • The Terrestrial coaxial cable or radio-relay system over FDM and digital transmission submarine coaxial cables add up to 4- 6 microseconds of delay per km.
  • Similarly even the optical fibre cable using digital transmission added around 5 microseconds per km delay which also accounts for the delay in repeaters and regenerators
  • On the other hand satellite, communication system varies the delay based on altitude ( propagation delay through space and between earth stations)
    • 400 km above earth surface adds 12 ms delay,
    • 14000 km above earth adds 110 ms
    • much higher 36000 km of altitude adds 260 ms

Devices

  • FDM modem adds upto 0.75 ms delay
  • Transmultiplexer – 1.5 ms delay
  • Exchanges ( analog , digital , transit ..) add 0.45 – 0.825 ms delay
  • Echo cancellers 0.5 ms
  • DCME (Circuit manipulation, signal compression ) – 30 ms to 200 ms

RTT (Round Trip Time )

RTT is the time in milliseconds (ms) taken for data to travel to the target destination and back. In terms of SIP calls it is the time for a transaction to complete between caller/client and callee/server. It is calculated as when the packet was sent and when the acknowledgement for it was received.

High RTT : The media stream especially audio must not suffer a delay higher than 150 ms including all the processing delays at intermediate nodes and network latency. Any value above it is of poor quality. High RTT indicates a poor network quality and would result in the audio lag issue.

RTT vs Network ping calculation: RTT can represent full path network latency experienced by the packets and can do away with frequent ICMP ping/echo requests/probes to check network health. Although it should be noted that while pings happen in lower transport layers protocol, RTT happens at the high up application layer.

RTT is used to calculate RTO ( Request transmission timeouts )in TCP transmission ie how much time the sender should wait before retrying to send an unacknowledged packet.

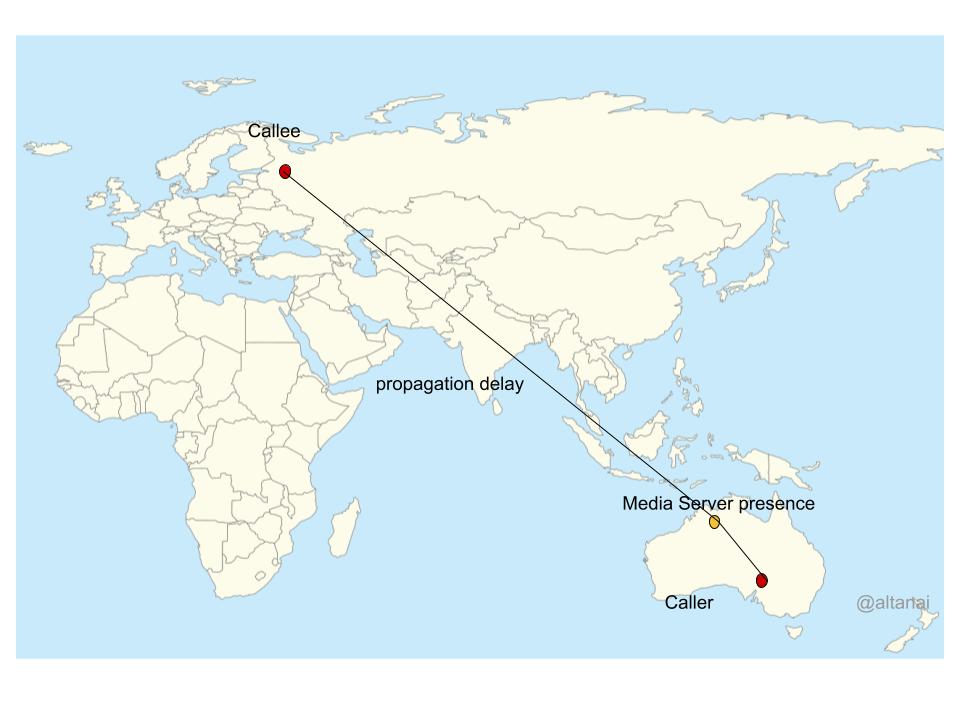
Factors affecting RTT can include delays in propagation delay, processing delay, queuing delay and encoding delay. Porpogation delay can correlate to the

  • physical distance ( inter country/continents or intra ) ,
  • mediaum of tramsission ( copper cables , fiber , wireless)
  • bandwidth available

Simillarly propagation delay can occur due to large num of network hops like routers / servers . It should be noted that server respose time also plays a critical role in RTT as it depends on server’s processing caapcity and nature of request.

Star based network topology like MCU , SFU or TURN servers can introduce processing delays too for activities such as mixing, encdoing , NATing etc .

Network congestion can amplify the RTT the most.Traffic level must be monitored when RTT spikes such as during DDos attacks

Overcoming large RTT can be achieved by

  • identifying the choke points of network
  • ditributing the load evenly
  • ensuring scalaibility of the server side resources
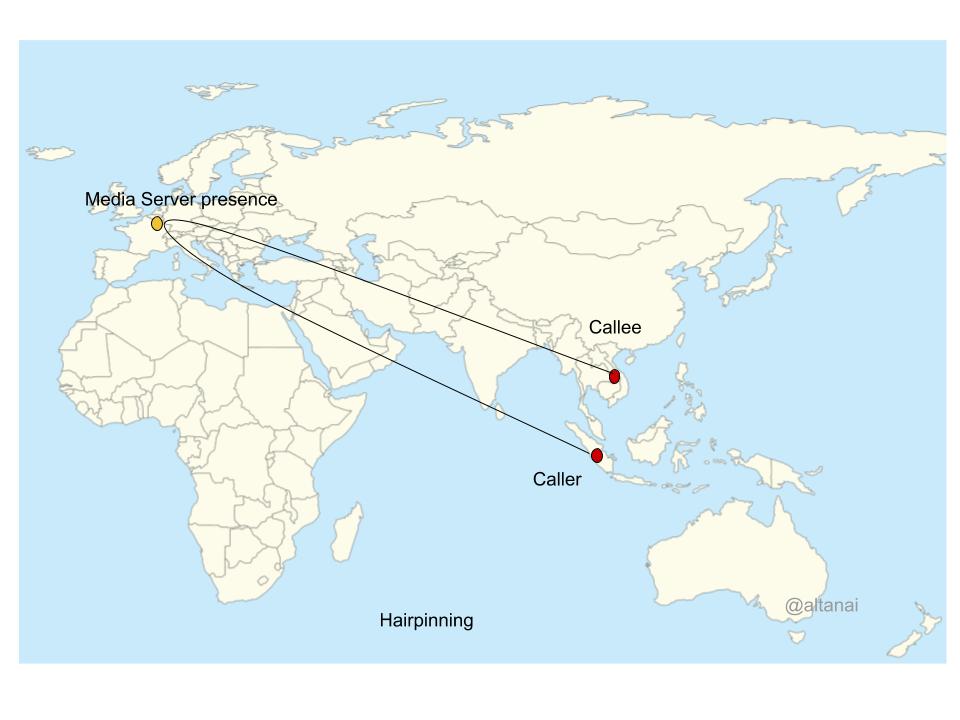
  • ensuring points of presence(PoP) into geographic regions where caller/ callee is present and routing through it rather than unreliable open public network

Note : avg RTT of the session is misleading denotaion of latency as there maybe be assymetrically RTT between the two legs of the call

Calculation of RTT

EffectiveLatency = ( AverageLatency + Jitter * 2 + 10 )

In RTPengine
int eff_rtt = ssb->rtt / 1000 + ssb->jitter * 2 + 10;

Thus for RTT = 11338 and jitter =0
eff_RTT = 11338/1000 + 0*2 +10
= 11.651 + 10 = 21.651 , which is a good score as it is way below 150ms of latency

But for RTT = 129209 and jitter =7
eff_RTT = 129209/1000 + 7*2 +10
= 153.209 , which is a bad score > 150 ms

Packet Loss

When packet does not successfully make it to the destination , it is a lost packet.

It could happen due to multiple reasons such as

  • network bandwidth unavailable or network congestion
  • overloading of the buffer such that they do not have enough space to queue the packets or high priority preferences
  • intentionally configuring ACL or firewalls to drop the packets or discarding packets above rate limit by internet service provider
  • CPU unable to cope up with high security networks encryption and decryption speed requirements
  • Low battery on device may cause cause underworking of devices and hence lead to packet loss
  • limitation on physical device like softphone , hardphone or bluetooth headsets or if the hardware is broken at router , switch or cabling
  • for bluetooth headsets distance range could also be problem for weak signals and consequently packets drops
  • network errors as shown under Simple Network Management Protocol (SNMP) issues like FCS Errors, Alignment Errors, Frame Too Longs, MAC Receive Errors, Symbol Errors, Collisions, Carrier Sense Errors, Outbound Errors, Outbound Discards, Inbound Discards, Inbound Errors, and Unknown Protocol errors.
  • radio frequency interference from high voltage systems or microwaves can also cause packet drop in wireless networks

such that the packet can either not arrive or arrive late and be dropped out by the codec . To the listener it would appear like chopped voice or complete dropout for moments .

Obtaining packet loss details

  • Packet loss percentage is performed as per RFC 3550 using RTP header sequence numbers. If packets are missing sequence the media stream monitors flags that as lost packet.
  • It can also be concluded from the difference between total packets and received packets from CDR
  • RTP-XR (RFC-3611) records report real-time drops

Jitter

The variation in the delay of received packets in a flow, measured by comparing the interval when RTP packets were sent to the interval at which they were received.
For instance, if packet #1 and packet #2 leave 30 milliseconds apart and arrive 50 milliseconds apart, then the jitter is 20 milliseconds or if packets transmitted every 15ms and reach destination at every 15ms then there is no variability and the jitter is 0.

Causes of jitter

  • Frame bigger than jitter buffer size
  • algorithms to back-of collision by introducing delays in packet transmission in half duplex interfaces
  • even small jitter can get exponentially worse on slow or congestion links
  • jitter can be introduced due to bottlenecks near router buffer, rerouting / parallel routes to the same destination, load-sharing, or route tables changing the path

Handling jitter :

Jitter below 30ms is manageable with the help of jitter buffers in codecs however above that the codec starts to drop the late arrived packets and cannot reassemble / splice up the packets for a smooth media stream effectively, hence causing media quality issues like clipped audio

Detecting jitter:

  • looking at inter packet gap in the direction of RTP stream in wireshark
  • RTP-XR (RFC-3611 & RFC-7005) for real-time jitter buffer usage and drops.
  • software based detection : Network sniffers wireshark , path analyser, Application Performance Monitoring (APM) Tools , CDR analyser , Simple Network Management Protocol (SNMP) Collector
MetricGoodAverageBad
Jitter<= 10ms10ms – 30ms>=30ms
Packet Loss< 0.5%0.5% – 0.9%>= 0.9%
Audio Level>-40dB-80dB to -40dB< -80dB
RTT< 200ms200ms – 300ms> 300ms
Range for good bad attributes for calculating mos score

Ref : ITU P.800.1 : Mean opinion score (MOS) terminology 

Methods for objective and subjective assessment of speech and video quality.

Scheduling for low bandwidth networks

The ability of the end application or the RTP proxy to deal with packet loss or delays depends on its processing techniques , particularly with encoding and buffering techniquee to deal with high pac ket loss rate.

Mapping R-value to calculate MOS

To map MOS from R value using above defined metrics , a standard formula is used. First the latency and jitter are added and defined value for computation time is also added , resulting in effective latency

effectiveLatency = latency + jitter * latencyImpact + compTime

Subtracting effective latency from defined R

R = 93 – (effectiveLatency / factorLatencyBased)

Calculate percentage of packet loss

 R = R – (lostPackets * impact)
 MOS = ( (R - 60) * (100 – R) * 0.000007R) + 0.035R + 1)

Media Stats and MOS on RTP engine Kamailio

Minimum edge Values

mos_min_pv
minimum encountered MOS value for the call.
range – 1.0 to 5.0.

mos_min_at_pv
timestamp of when the minimum MOS value was encountered during the call

mos_min_packetloss_pv
amount of packetloss in percent at the time the minimum MOS value was encountered

mos_min_roundtrip_pv
packet round-trip time in milliseconds at the time the minimum MOS value was encountered

mos_min_jitter_pv
amount of jitter in milliseconds at the time the minimum MOS value was encountered

Maximum edge Values

mos_max_pv
maximum encountered MOS value for the call.

mos_max_at_pv
timestamp of when the maximum MOS value was encountered during the cal

mos_max_packetloss_pv
amount of packetloss in percent at maximum MOS moment

mos_max_roundtrip_pv
packet round-trip time in milliseconds at maximum MOS moment

mos_max_jitter_pv
amount of jitter in milliseconds at maximum moment

Average Values

mos_average_pv : average (median) MOS value for the call. Range – 1.0 through 5.0.

mos_average_packetloss_pv : average (median) amount of packetloss in percent present throughout the call.

mos_average_jitter_pv : average (median) amount of jitter in milliseconds present throughout the call.

mos_average_roundtrip_pv

mos_average_samples_pv : number of samples used to determine the other “average” MOS data points.

Labels

mos_A_label_pv : custom label used in rtpengine signalling.
If set, all the statistics pseudovariables with the A suffix will be filled in with statistics only from the call legs that match the label given in this variable.

A label’s min
mos_min_A_pv
mos_min_at_A_pv
mos_min_packetloss_A_pv
mos_min_jitter_A_pv
mos_min_roundtrip_A_pv

A label’s max
mos_max_A_pv
mos_max_at_A_pv
mos_max_packetloss_A_pv
mos_max_jitter_A_pv
mos_max_roundtrip_A_pv

A label’s average
mos_average_A_pv
mos_average_packetloss_A_pv
mos_average_jitter_A_pv
mos_average_roundtrip_A_pv
mos_average_samples_A_pv

B labels’s min
mos_B_label_pv
mos_min_B_pv
mos_min_at_B_pv
mos_min_packetloss_B_pv
mos_min_jitter_B_pv
mos_min_roundtrip_B_pv

B label’s max
mos_max_B_pv
mos_max_at_B_pv
mos_max_packetloss_B_pv
mos_max_jitter_B_pv
mos_max_roundtrip_B_pv

B label’s average
mos_average_B_pv
mos_average_packetloss_B_pv
mos_average_jitter_B_pv
mos_average_roundtrip_B_pv
mos_average_samples_B_pv

Setting MOS collection on kamailio

set the kamailio config rtpengine params for names the variable the hold specific mos values

modparam("rtpengine", "mos_max_pv", "$avp(mos_max)")
modparam("rtpengine", "mos_average_pv", "$avp(mos_average)")
modparam("rtpengine", "mos_min_pv", "$avp(mos_min)")

modparam("rtpengine", "mos_average_packetloss_pv", "$avp(mos_average_packetloss)")
modparam("rtpengine", "mos_average_jitter_pv", "$avp(mos_average_jitter)")
modparam("rtpengine", "mos_average_roundtrip_pv", "$avp(mos_average_roundtrip)")
modparam("rtpengine", "mos_average_samples_pv", "$avp(mos_average_samples)")

modparam("rtpengine", "mos_min_pv", "$avp(mos_min)")
modparam("rtpengine", "mos_min_at_pv", "$avp(mos_min_at)")
modparam("rtpengine", "mos_min_packetloss_pv", "$avp(mos_min_packetloss)")
modparam("rtpengine", "mos_min_jitter_pv", "$avp(mos_min_jitter)")
modparam("rtpengine", "mos_min_roundtrip_pv", "$avp(mos_min_roundtrip)")

modparam("rtpengine", "mos_max_pv", "$avp(mos_max)")
modparam("rtpengine", "mos_max_at_pv", "$avp(mos_max_at)")
modparam("rtpengine", "mos_max_packetloss_pv", "$avp(mos_max_packetloss)")
modparam("rtpengine", "mos_max_jitter_pv", "$avp(mos_max_jitter)")
modparam("rtpengine", "mos_max_roundtrip_pv", "$avp(mos_max_roundtrip)")

modparam("rtpengine", "mos_A_label_pv", "$avp(mos_A_label)")
modparam("rtpengine", "mos_average_packetloss_A_pv", "$avp(mos_average_packetloss_A)")
modparam("rtpengine", "mos_average_jitter_A_pv", "$avp(mos_average_jitter_A)")
modparam("rtpengine", "mos_average_roundtrip_A_pv", "$avp(mos_average_roundtrip_A)")
modparam("rtpengine", "mos_average_A_pv", "$avp(mos_average_A)")

modparam("rtpengine", "mos_B_label_pv", "$avp(mos_B_label)")
modparam("rtpengine", "mos_average_packetloss_B_pv", "$avp(mos_average_packetloss_B)")
modparam("rtpengine", "mos_average_jitter_B_pv", "$avp(mos_average_jitter_B)")
modparam("rtpengine", "mos_average_roundtrip_B_pv", "$avp(mos_average_roundtrip_B)")
modparam("rtpengine", "mos_average_B_pv", "$avp(mos_average_B)")

For individual leg labbeling fill up the lables

KSR.pv.sets("$avp(mos_A_label)","Aleg_label")
KSR.pv.sets("$avp(mos_B_label)","Bleg_label")

Gather the mos stats from the code . Given exmaple is in Lua.
The values are filled in after invoking“rtpengine_delete”, “rtpengine_query”, or “rtpengine_manage” if the command resulted in a deletion of the call (or call branch).

KSR.log("info", " mos avg " .. KSR.pv.get("$avp(mos_average)"))
KSR.log("info", " mos max " .. KSR.pv.get("$avp(mos_max)"))
KSR.log("info", " mos min " .. KSR.pv.get("$avp(mos_min)"))

KSR.log("info", "mos_average_packetloss_pv" .. KSR.pv.get("$avp(mos_average_packetloss)"))
KSR.log("info", "mos_average_jitter_pv" .. KSR.pv.get("$avp(mos_average_jitter)"))
KSR.log("info", "mos_average_roundtrip_pv" .. KSR.pv.get("$avp(mos_average_roundtrip)"))
KSR.log("info", "mos_average_samples_pv" .. KSR.pv.get("$avp(mos_average_samples)"))

KSR.log("info", "mos_min_pv" .. KSR.pv.get("$avp(mos_min)"))
KSR.log("info", "mos_min_at_pv" .. KSR.pv.get("$avp(mos_min_at)"))
KSR.log("info", "mos_min_packetloss_pv" .. KSR.pv.get("$avp(mos_min_packetloss)"))
KSR.log("info", "mos_min_jitter_pv" .. KSR.pv.get("$avp(mos_min_jitter)"))
KSR.log("info", "mos_min_roundtrip_pv" .. KSR.pv.get("$avp(mos_min_roundtrip)"))

KSR.log("info", "mos_max_pv" .. KSR.pv.get("$avp(mos_max)"))
KSR.log("info", "mos_max_at_pv" .. KSR.pv.get("$avp(mos_max_at)"))
KSR.log("info", "mos_max_packetloss_pv" .. KSR.pv.get("$avp(mos_max_packetloss)"))
KSR.log("info", "mos_max_jitter_pv" .. KSR.pv.get("$avp(mos_max_jitter)"))
KSR.log("info", "mos_max_roundtrip_pv" .. KSR.pv.get("$avp(mos_max_roundtrip)"))

local mos_A_label = KSR.pv.get("$avp(mos_A_label)")
if not (mos_A_label == nil) then
    KSR.log("info", "mos_average_packetloss_A_pv" .. KSR.pv.get("$avp(mos_average_packetloss_A)"))
    KSR.log("info", "mos_average_jitter_A_pv" .. KSR.pv.get("$avp(mos_average_jitter_A)"))
    KSR.log("info", "mos_average_roundtrip_A_pv" .. KSR.pv.get("$avp(mos_average_roundtrip_A)"))
    KSR.log("info", "mos_average_A_pv" .. KSR.pv.get("$avp(mos_average_A)"))
end

local mos_B_label = KSR.pv.get("$avp(mos_B_label)")
if not (mos_B_label == nil) then
    KSR.log("info", "mos_average_packetloss_B_pv" .. KSR.pv.get("$avp(mos_average_packetloss_B)"))
    KSR.log("info", "mos_average_jitter_B_pv" .. KSR.pv.get("$avp(mos_average_jitter_B)"))
    KSR.log("info", "mos_average_roundtrip_B_pv" .. KSR.pv.get("$avp(mos_average_roundtrip_B)"))
    KSR.log("info", "mos_average_B_pv" .. KSR.pv.get("$avp(mos_average_B)"))
end

Sample obtained result for one leg

      "average MOS": {
        "MOS": 43,
        "round-trip time": 13430,
        "jitter": 0,
        "packet loss": 0,
        "samples": 4
      },
      "lowest MOS": {
        "MOS": 43,
        "round-trip time": 24184,
        "jitter": 0,
        "packet loss": 0,
        "reported at": 1590498085
      },
      "highest MOS": {
        "MOS": 44,
        "round-trip time": 8218,
        "jitter": 0,
        "packet loss": 0,
        "reported at": 1590498089
      },

CDR with MOS on Freeswitch

<?xmlversion="1.0"?>
					
<cdr core-uuid="[UUID]" switchname="freeswitch">
<channel_data>
	<state>
	<direction>
	<state_number>
	<flags>	
	<caps>
</channel_data>
					
<call-stats>			
//Audio Compoennts 		
// Video Component
</call-stats>

// Variables 			

<app_log>			
	<application app_name="..."app_data="...">
	<application app_name="..."app_data="...">
</app_log>
				
// Callflow 
				
</cdr>		

Audio

<audio>	
	<inbound>
		<raw_bytes>	
		<media_bytes>
		<packet_count>
		<media_packet_count>		
		<skip_packet_count>
		<jitter_packet_count>
		<dtmf_packet_count>	
		<cng_packet_count>		
		<flush_packet_count>
		<largest_jb_size>
		<jitter_min_variance>
		<jitter_max_variance>
		<jitter_loss_rate>
		<jitter_burst_rate>
		<mean_interval>
		<flaw_total>
		<quality_percentage>
		<mos>
	</inbound>				
	<outbound>
		<raw_bytes>
		<media_bytes>
		<packet_count>
		<media_packet_count>
		<skip_packet_count>
		<dtmf_packet_count>
		<cng_packet_count>
		<rtcp_packet_count>
		<rtcp_octet_count>
	</outbound>	
</audio>

Video

<video>	
	<inbound>
		<raw_bytes>
		<media_bytes>
		<packet_count>
		<media_packet_count>
		<skip_packet_count>
		<jitter_packet_count>
		<dtmf_packet_count>
		<cng_packet_count>
		<flush_packet_count>
		<largest_jb_size>
		<jitter_min_variance>
		<jitter_max_variance>
		<jitter_loss_rate>
		<jitter_burst_rate>
		<mean_interval>
		<flaw_total>
		<quality_percentage>
		<mos>
	</inbound>	
	<outbound>
		<raw_bytes>
		<media_bytes>
		<packet_count>
		<media_packet_count>
		<skip_packet_count>
		<dtmf_packet_count>
		<cng_packet_count>
		<rtcp_packet_count>
		<rtcp_octet_count>	
	</outbound>
</video>

The variables

<variables>		
<is_outbound>
<uuid><session_id><text_media_flow>
<direction>
<ep_codec_string>
<channel_name>
<secondary_recovery_module>
<verto_dvar_email><verto_dvar_avatar><jsock_uuid_str>
<verto_user><presence_id>
<verto_client_address><chat_proto>
<verto_host><event_channel_cookie>
<verto_profile_name>
<record_stereo><default_areacode><transfer_fallback_extension>
<toll_allow><accountcode><user_context><effective_caller_id_name><effective_caller_id_number>
<outbound_caller_id_name><outbound_caller_id_number><callgroup><user_name><domain_name>
<Event-Name>
<Core-UUID>
<FreeSWITCH-Hostname><FreeSWITCH-Switchname><FreeSWITCH-IPv4><FreeSWITCH-IPv6><Event-Date-Local><Event-Date-GMT><Event-Date-Timestamp>
<Event-Calling-File>
<Event-Calling-Function>
<Event-Calling-Line-Number>
<Event-Sequence>
<verto_remote_caller_id_name><verto_remote_caller_id_number>
<switch_r_sdp>

<call_uuid><open>
<rtp_secure_media>
<export_vars><conference_enter_sound>
<conference_exit_sound><video_banner_text>
<rtp_use_codec_string><remote_audio_media_flow>
<audio_media_flow>
<rtp_audio_recv_pt>
<rtp_use_codec_name> 
<rtp_use_codec_fmtp>
<rtp_use_codec_rate>
<rtp_use_codec_ptime>
<rtp_use_codec_channels>
<rtp_last_audio_codec_string>
<original_read_codec>
<original_read_rate>
<write_codec><write_rate>
<remote_audio_ip>
<remote_audio_port>
<remote_audio_rtcp_ip>
<remote_audio_rtcp_port>
<dtmf_type>
<remote_video_media_flow>
<video_media_flow>
<video_possible>
<rtp_video_pt>
<rtp_video_recv_pt>
<video_read_codec>
<video_read_rate><video_write_codec><video_write_rate><rtp_last_video_codec_string>
<rtp_use_video_codec_name>
<rtp_use_video_codec_rate>
<rtp_use_video_codec_ptime>
<remote_video_ip><remote_video_port>
<remote_video_rtcp_ip><remote_video_rtcp_port>
<local_media_ip><local_media_port>
<advertised_media_ip>
<rtp_use_timer_name><rtp_use_pt>
<rtp_use_ssrc><rtp_2833_send_payload>
<rtp_2833_recv_payload><remote_media_ip>
<remote_media_port><local_video_ip>
<local_video_port><rtp_use_video_pt><rtp_use_video_ssrc><rtp_local_sdp_str><current_application_data><current_application><send_silence_when_idle><rtp_has_crypto><endpoint_disposition><conference_name><conference_member_id><conference_moderator><conference_ghost><conference_uuid><video_width><video_height><video_fps><verto_hangup_disposition><read_codec><read_rate><hangup_cause><hangup_cause_q850>
<digits_dialed>
<start_stamp><profile_start_stamp><answer_stamp><progress_media_stamp><end_stamp>
<start_epoch><start_uepoch>
<profile_start_epoch><profile_start_uepoch>
<answer_epoch><answer_uepoch>
<bridge_epoch><bridge_uepoch>
<last_hold_epoch><last_hold_uepoch>
<hold_accum_seconds><hold_accum_usec><hold_accum_ms><resurrect_epoch><resurrect_uepoch>
<progress_epoch><progress_uepoch><progress_media_epoch><progress_media_uepoch>
<end_epoch><end_uepoch>
<last_app><last_arg><caller_id><duration><billsec><progresssec><answersec><waitsec><progress_mediasec>

<flow_billsec>
   <mduration><billmsec><progressmsec><answermsec><waitmsec><progress_mediamsec><flow_billmsec><uduration>  <billusec><progressusec><answerusec><waitusec><progress_mediausec>
<flow_billusec>

<rtp_audio_in_raw_bytes>
<rtp_audio_in_media_bytes>
<rtp_audio_in_packet_count>
<rtp_audio_in_media_packet_count>
<rtp_audio_in_skip_packet_count><rtp_audio_in_jitter_packet_count><rtp_audio_in_dtmf_packet_count>
<rtp_audio_in_cng_packet_count>
<rtp_audio_in_flush_packet_count>
<rtp_audio_in_largest_jb_size>
<rtp_audio_in_jitter_min_variance><rtp_audio_in_jitter_max_variance>
<rtp_audio_in_jitter_loss_rate>
<rtp_audio_in_jitter_burst_rate>
<rtp_audio_in_mean_interval>
<rtp_audio_in_flaw_total>
<rtp_audio_in_quality_percentage>
<rtp_audio_in_mos>
<rtp_audio_out_raw_bytes>
<rtp_audio_out_media_bytes>
<rtp_audio_out_packet_count>
<rtp_audio_out_media_packet_count><rtp_audio_out_skip_packet_count><rtp_audio_out_dtmf_packet_count>
<rtp_audio_out_cng_packet_count>
<rtp_audio_rtcp_packet_count>
<rtp_audio_rtcp_octet_count>
<rtp_video_in_raw_bytes>
<rtp_video_in_media_bytes>
<rtp_video_in_packet_count>
<rtp_video_in_media_packet_count>
<rtp_video_in_skip_packet_count><rtp_video_in_jitter_packet_count><rtp_video_in_dtmf_packet_count>
<rtp_video_in_cng_packet_count>
<rtp_video_in_flush_packet_count>
<rtp_video_in_largest_jb_size>
<rtp_video_in_jitter_min_variance><rtp_video_in_jitter_max_variance>
<rtp_video_in_jitter_loss_rate>
<rtp_video_in_jitter_burst_rate>
<rtp_video_in_mean_interval
><rtp_video_in_flaw_total>
<rtp_video_in_quality_percentage>
<rtp_video_in_mos>
<rtp_video_out_raw_bytes>
<rtp_video_out_media_bytes>
<rtp_video_out_packet_count>
<rtp_video_out_media_packet_count><rtp_video_out_skip_packet_count><rtp_video_out_dtmf_packet_count>
<rtp_video_out_cng_packet_count>
<rtp_video_rtcp_packet_count>
<rtp_video_rtcp_octet_count>

</variables>

The Callflow components

<callflow dialplan="XML" unique-id="[UUID]" profile_index="1">
	
	<extension name="myconference" number="3500">		
		<application app_name="..." app_data="...">
	</extension>	
	<caller_profile>
		<username>
		<dialplan>
		<caller_id_name>
		<caller_id_number>
		<callee_id_name>
		<callee_id_number>
		<ani>
		<aniii>
		<network_addr>
		<rdnis>
		<destination_number>
		<uuid>
		<source>
		<context>
		<chan_name>
	</caller_profile>
				
			
	<times>
		<created_time>
		<profile_created_time>
		<progress_time>	
		<progress_media_time>
		<answered_time>
		<bridged_time>
		<last_hold_time>	
		<hold_accum_time>
		<hangup_time>
		<resurrect_time>	
		<transfer_time>	
	</times>
</callflow>

Standardising bodies :-

  • ITU (The International Telecommunication Union) is the United Nations specialised agency in the field of telecommunications, information and communication technologies (ICTs).
  • ITU-T ( ITU Telecommunication Standardisation Sector) is responsible for studying technical, operating and tariff questions and issuing Recommendations on them with a view to standardising tele-communications on a worldwide basis.

As the technology for packet switching matured, the voice quality between circuit-switched and packet-switched networks is mostly indistinguishable. However, the flaws in the VoIP communication system reappear under low network conditions and bad architecture design. Especially with applications that are greedy for network bandwidth such as large scale conferencing or HD streaming, the need for monitoring and quality control is very high, which can be only met by above described QoS parameters.

References

  • CDR on freeswitch
  • ITU-T G.114 TELECOMMUNICATION STANDARDIZATION SECTOR OF ITU (05/2003) SERIES G: TRANSMISSION SYSTEMS AND MEDIA, DIGITAL SYSTEMS AND NETWORKS , International telephone connections and circuits – General Recommendations on the transmission qua
  • Kamailio RTP engine https://www.kamailio.org/docs/modules/devel/modules/rtpengine.html

Connected Self Driving Cars

Self driving tech includes Radar, Ultrasonic, Passive video, LIDAR (Light Detection and Radar) , IoT , sensors , advanced GPS so on . Machine learning models on Computer vision is disrupting automobile industry and likely to create a multi billion dollar market in near future..

To make the traffic and transportation infrastructure more robust, “connected cars” is an overlay technlogy which will enable vehicles to communicate when in vicinty and help mitigate accident and clogging risks.

Since each car will consume and process terabytes of data , enabling intercommunication between vehicles will help in resource sharing and auto syncing updates.

Inter vehicle communications – V2V

Vehicles can communicate wirelessly (Bluetooth, LTE, 5G ultra wideband, cellular-V2X, LoRA …) via vehicle-to-vehicle (V2V) and vehicle-to-infrastructure (V2I), including location, speed, direction. This imporves coordination among vehicular traffic and reduces congestion.

Inter car Connectivity enables automation by serving as an additional sensor for functions like acceleration , braking , streering with activated response.

Since its inception with google Waymo , Uber and Lyft in 2016-18 with CES show stoopers such as Drive.ai , nuTonomy the future of self driving cars looks bright indeed. Today ( at the time of writing this article -2020) , self -driving or autonomous cars are not only capturing personal vehicles market but also truck / transportaion service and even fleet management and cab services.

Advantages of connnected Cars

  • Allows drivers to be warned of emerging dangerous situations in envrionmnet
  • Vehicles can anonymously and securely exchange data with other vehicles

In additon to points above there are potential indirect benifits to connected vehicles too

  • Reduces accident fatalities and injuries
  • Increase vehicle effiency and decreased carbon emissions
  • Lower fright transportation costs and land use for mobility
  • intelligent parking and prioritization in checkouot lanes

Levels of autonomy in self driving cars

Level 0 – No Automation . Manually controlled while still enabling communication like warning and alrts for blind spots etc

Level 1 – Driver Assiatance . Vehicle can control streering or speed although human driver is reponsible for his saftey and operation. Adaptive cruise conrol and lane departure are an exmaple of this level .

Level 2 : Partial Automation .  vehicle is able to detect the environment, control acceleration, breaking and steering, and navigate complex traffic situations without any driver intervention. Yet driver needs to take over instantly at any time when required.

Level 3 : Request to intervene . vehicles control all features of driving and can make informed decisions such as overtaking slower moving vehicles. The expectation is that the human driver will be ready to respond to a request to intervene when issued by the automated driving system. Traffic jam chauffeur is an example 

Level 4 : High Automation . vehicle is capable of full automation in limited conditions  ie operation design domain (ODD). this  can include environmental, geographical and time-of-day restrictions and/or the requisite presence or absence of certain traffic or roadway characteristics.

Level 5 : Full Automation  .  specified automated driving features are engaged and a human driver is not necessary.

AutoDriving Car Features that require Communication

Adaptive cruise control (ACC) is an available cruise control advanced driver-assistance system for road vehicles that automatically adjusts the vehicle speed to maintain a safe distance from vehicles ahead. Also applied to Obstacle Aware Cruise control .

Blind Spot collision warning vehicle-based sensor device that detects other vehicles located to the driver’s side and rear. Warnings can be visual, audible, vibrating, or tactile

Auto steer / lane departure warning system (LDWS) warn the driver when the vehicle begins to move out of its lane on freeways or anterial roads.

Front collision warning   of impending collisions with slower moving or stationary cars. Also applies tot Side collision warnings as well as emergency braking.

Emergency Lane Departure Avoidance

Tesla HW2 camera

Real Time Media Streaming in Connected Cars and V2V

WebRTC is a robust , royality free , end to end encrypted p2p media streaming API . After its rapid adoption by all communication providers and CPaaS solutions , WebRTC also found many applications in IoT ( Internet of things ) especially creating low latency streams.

  •  Tracking your destination on the map using edge computing
  •  Initiate video chat with the guiding server
  • QT embedded based GUI development
  • Connectivity Framework

Emergency Calling

On collision the impacted Cars notify other cars of collision ahead , if required can live stream the feed on WebRTC too so they can access teh situationa nd if required can provide emregncy reponse too . In addition the cars auto call the central communicationo server which will triger callflow to bring police , insurance , medical teams oncall with car and live stream from the cars cameras .

Cars connected to Communication platform as SIP/WebRTC capable endpoints

Connected Vehicle Solution using Next Generation Telematics Protocol ( NGTP)

NGTP is an open-source framework that allows over-the-air delivery of integrated data and services to a range of connected vehicles

References :

Active research groups for Car2Car communication

  • Mcity – University of Michigan

Blockchain integarted with Voice over IP platforms

Blockchain is essentially a decentralized algorithm for distributed storage and processing , using a non immutable data structures and securing them with signatures and keys . These sequential chain of records called blocks , can contains almost anything from timestamped transactions , metadata , contracts , files etc just as long as they are chained using hash pointers to previous blocks  .

Proposed by Satoshi Nakamoto in 2008 , iti was deisgned to be a p2p system for electronic cash and took the form of digital btcoin currency in 2009 . This was in stark contrast to existing currency model since in bitcoin one could :

provide proof of who own what at any given momemt

payment history of every bitcoin in circulation

cryptographic validation of transaction thats theoritically impossoble to alter once registered

copies of data are distributed among various nodesin bitcoin network

independant consensus mechanicm that rpelaces the bank system of central ledger

Applications of block chain :

Market analysts and industry specialist have said that block-chain is a revolutionizing technology which will create a decentralized network for not just currency exchange but also many other aspects such as double spent problem , universal identities  , document management etc .

Example : Bitcoin protocol , which contains a full record of every transaction ever executed with the currency at any time in past. It is also a remody to counter problems like black – money , double spending , tax evasions etc.

Beyong digital currency , applications of blockchain find use in –

  • Decentralizing document keeping such as government records , digital assets , equity information , medical and health records etc . The system also provide data ownership and Intellectual property protection .
  • Fintech as AML( Anti money laundering) , eKYC ( Know Your customer)  , epay , loans, stock trading .
  • Smart contracts such as in ethereum . Allows to keep program code that would execute on an event.
  • Shared economy for a p2p payment system .
  • Crowdfunding , works on paradigm of  token owner’s voting and cooperation in decisions for crowd-sourced venture capital funds .
  • Micro payments / fractional concurrency for small amounts suits power selling and buying  such as on solar renewable power micro grid

What is a hash ?

function f (x) = y , takes an i/o and give a determined o/p . 

Example heaxadecimeal output of my name , md5(altanai bisht) = 2b9e76d57842ebafaf19fd33bb3573a3.

These are irreversible ie one cant find the input from output . For this you’d need to try every combination using brute force. Hence these are generally used for cross verification without revealing the information itself .

Since a block chain is a ledger of facts shared across many peer nodes , all communication and inter node transaction uses the power of crypto to authenticate  each other and validate each others requests from the genesis block .

What is a genesis block ?

First block of blockchain which needs to be hard-coded into software . It is the only block which does not reference a previous block .

As any peer wants to add a fact to the ledger , a consensus needs to be obtained from the network. This way of network agreement ensures that fraudulent behavior is prevented .

Example : bitcoin’s genesis block

01000000 - version
0000000000000000000000000000000000000000000000000000000000000000 - prev block
3BA3EDFD7A7B12B27AC72C3E67768F617FC81BC3888A51323A9FB8AA4B1E5E4A - merkle root
29AB5F49 - timestamp
FFFF001D - bits
1DAC2B7C - nonce
01 - number of transactions
01000000 - version
01 - input
0000000000000000000000000000000000000000000000000000000000000000FFFFFFFF - prev output
4D - script length
04FFFF001D0104455468652054696D65732030332F4A616E2F32303039204368616E63656C6C6F72206F6E206272696E6B206F66207365636F6E64206261696C6F757420666F722062616E6B73 - scriptsig
FFFFFFFF - sequence
01 - outputs
00F2052A01000000 - 50 BTC
43 - pk_script length
4104678AFDB0FE5548271967F1A67130B7105CD6A828E03909A67962E0EA1F61DEB649F6BC3F4CEF38C4F35504E51EC112DE5C384DF7BA0B8D578A4C702B6BF11D5FAC - pk_script
00000000 - lock time

What is proof -of -work ?

PoW ( proof of work ) is leveraging computing power to solve complex cryptographic problemsthat add block to chain and also validate the transactions . The updated chain then becomes the new reference for further transactions .

Forks 

There is only one path from top block on chain to genesis root , however  there can many forks upwards from genesis block . It is so because blocks may be created within a short span of time or be  under processing . One of the two block will be added to main chain and other will be orphaned or added to pool of queued transactions or even be lost.

Blockchain integarted with Voice over IP platforms

To overcome the flaws of current cellular, LTE, SIP PBX and WebRTC CPaaS ( Communication as platform services ) with multiple sources of truth for call records to track conversations and maintain context, we are decentralising few components of VoIP platform and cloud communications such as registrar & CDR using smart contracts and delegated proof of stake. Part of blockchain algorithms. Boosting security and credibility in VOIP ecosystem by leveraging the power of blockchain algorithms for CDR (Call Detail Records).

If a call log is broadcasted to every node in the network, verified and a copy is maintained by peers, the call records are as secure as a monetary transaction made over a bitcoins. This is because they are added to ledger encrypted with digital security code, with the assurance of being unalterable and permanent.

Decentralised Call Record ( CDR ) system on blockchains

For the headless browser-based clients, the users maintain their call information in a distributed fashion and own the mutual responsibility to share, hash, sign and validate the records. There is no single point of failure. The cryptographic hashes and digital signatures on the chain structure of Merkel tree ensure that the Data layer, where the actual data structure and physical storage is made, is secured, while the p2p broadcast and local validation on network side ensure that all nodes approve of the incoming call setup. The consensus is obtained by proof of work and smart contracts are used for binding the call arrangement.

Advantages of Persistent, Distributed, Decentralized Algorithm based CDR system such as Blockchain

Advantages of this approach are manyfold. For the telephony architecture, no logging takes place at the central server as it only places the role of proxying the connection and exchanging SIP request/response based on SIP URI. Hence the backend servers no longer need to maintain resource-intensive Database operations or AAA ( authentication- authorization- accounting ). New call requests are propagated and advertised to other peer nodes. Peer nodes called miners accept the block, compute proof of work and broadcast back to other nodes. The rest of the nodes append the information to their blockchain using the previously accepted hash. The call receiver receives the confirmation and can now accept or reject the call.

Pros and cons of using blockcchain to maintain CDR in SIP/WebRTC CPaaS

If a call is broadcasted to every node in the network, verified and a copy is maintained by peers, the call records are as secure as a monetary transaction made over a bitcoins. This is because they are added to ledger encrypted with digital security code, with the assurance of being unalterable and permanent.

The world is fast moving towards the open and decentralised economy and it is but obvious that telephony needs to catch-up and be at par with the emerging trends with plenty of re-engineering and design changes. Creating a peer to peer secured network for VoIP communication will ensure trust and security between callers and prevent spammers or fraudulent call behaviour. Also once a call is made, the call history is permanently stored and protected against revision.

Steps to Programming a simple block-chain application :

Lets assume we are creating a block chain for call records.

callstatus block chain

Structure of a block which is an object which typically looks like

block = {
"index" :1,
"timestamp " :20-02-2017/10:00
"callstatus " : [ { caller : sip:john@domain.com" ,
callee : "alice@domain.com ",
active call time : 3:00
]},
"proof" : 23897897
"previous hash ":"9868768"
}

Blocks have an index , timestamp , transactions ( in our case call status such as outgoing or incoming calls ) and the hash link of previous block , which enables the chain formation ,

Create a class , blockchain , for member function and variables. Create functions as :

  1. init() : create a new chain and transaction object
  2. createNewTranscation( ) : this creates the information which needs to be fed into the next mined block  and returns the index of the new block which the transaction will be added to .

function createNewTranscation(_caller , _callee , _calltime ){

current_transaction.append({
caller : _caller ,
callee : _callee,
activeCallTime : _calltime
})

return lastBlock['index'] +1;

}

  1. createNewBlock() : at first we need to create a genesis block
  2. fetchLastBlock() ,
  3. boolean isBlockValid ( newBlock , oldBlock) – checks if the oldblocks index is sequentially aligned with new block and whether old blocks hash is equal to new blocks previous hash . Also calculates whether hash of new block is actually same as the supplied hash value in new block ( give  below) .
  4. hashBlock( block ) –  to create the hashes we need to add in block. Basically a SHA 256 hash of concatenated arguments as index, timestamp, message , previous hash and a nonce .

Consensus Algorithms

All block-chains a\re deterministic state machines and transactions act upon them . Consensus filters out the invalid ones and reaches on agreement with valid ones.

DPOS (Delegated Proof of Stake)

A consensus algorithm used for electing producers and scheduling them in a fair and democratic way . It works on the simple principle that longest chain wins therefore incases of multiple forks or network disruption also , if an honest peer finds out a  valid strictly longer chain  , it will switch from its current fork to the longer chain. We assume that in all conditions ,  no other chain forked can be longer if 2/3 of producers are honest as 2/3 + 1 confirmations are required .

In crypto we trust !

Block chain is primarily 3 things : p2p network, public key cryptography and distributed consensus .

The security and accountability of such a system is managed via mass surveillance of transactions and cryptographic evidence. Ensures that blocks are always in chronological order  since meddling with the blocks will change the hash for preceding blocks

Asymmetric keys and digital signatures

Verification of block uses ECDSA ( Elliptic Curve Digital Signature Algorithm) to ensure that tokens are spend by their rightful owners only.

An ellipsis is a derived from the second degree equation like ax^2 + bcy + cy^2 + dx + ey +f =0 . Depending on attributes this could be hyperbola , parabola or even a circle . However elliptic curve cryptography uses a third degree equation  from either a pseudo -random curve  ( such as over prime  fields y^2=x^3+ax+b or binary fields y^2 + xy = x^3 + ax^2 + b ) or a special curve .

What is ECDSA ?

There are 2 types of auth schemes : Symmetric , relying on shared secret key and Asymmetric relying on private public keys . ECDSA is a asymmetric authentication scheme where in addition to sender and receiver , even 3rd party systems can be authenticated .  In this the sender uses his private key to sign the message and receiver uses the senders public key to verify the message’s signature .

ECDSA signature

Difficulty 

While publishing a block with pending facts  to be appended to a chain , the owner sends it to other nodes for confirmation on its validity. Once its approved , other nodes called miners add it to their copy of chains. However the new block has to be published after fixed time interval for fraud prevention ( example :  bitcoin blocks are published every 10 mins on avg ) .  This duration is dynamically recalculated as the network miners grow or shrink . A difficulty is a number metric that represents how difficult is it to find a hash for given target.

  • To force increase time for calculating the matching hash  , difficulty is increased for miners work harder and take longer to earn the block reward .
  • While  in case of  less miner participation , the block difficulty level is made lower

Ref :

  • “If blockchains ran the world – Disrupting the trust business,” The Economist, July 6, 2017,-http://worldif.economist.com/article/13525/disrupting-trust-business.

WebRTC for financial / banks communications

As digital transactions and open banks APIs like UPI have gained massive adoption , the backend communication system between these wallets managers, financial institutions and open banks providers has become critical to not only track fraudulent transactions but also provide dispute management and other KYC or document sharing processes  .

WebRTC on banking pages for secure encrypted financial communication suecases

With browser based netbanking or transfer today it is simpler than ever  to offer personalised calls to users as he/she logs into their banking portal. A bank agent can connect with users over the call to assist in reviewing new loan policies, offers etc. This goal is realised with WebRTC API embedded in browser which enables agent – user communication to be embedded right inside the webpage of a laptop , tablet , mobile even Kiosk o smart TV.