Data Centres are the concentrated processing units for the amazing Internet that is driving the technological innovation of our generation and has become the backbone of our global economy. DataCentres not only process , store and carry textual data rather a vast amount of computing is for multimedia content which could range from social media to, video streaming or VoIP calls. In this article let us analyze the energy effiiciency , carbon footprint and scope of improvements for a VoIP related data centre which hosts SIP and related RTC technology signalling and media servers and process CDRs and/or media files for playback or recordings.
Just like a regular IT datacentre , storage, computing power and network capacity define the usage of the server.Also unobstructed electricty of of paramount importance as any blackout could drop ongoing calls and lead to loss of revenue for the service provider not to forget the loss caused to parties engaged in call.
Increasing Power consumption by telecom Sector over the years


Typical VoIP Setup : Whether a cloud Infrstrcture provider of a hosted data centre , an aproximate number of 7 servers is required even for SME ( small to medium enterprises ) communication system and VoIP systems
- 2 signalling servers primary and standby for HA ,
- 2 media server for MCU of media bridges or IVR playback etc ,
- 1 for CDR , logs or call analytics , stats and other supplementary operation
- 1 for dev or engineering team .
- 1 edge server could be API server or a gateway or laodbalancer.

VoIP solutions are more energy expensive, unless aggressive power saving schemes are in place
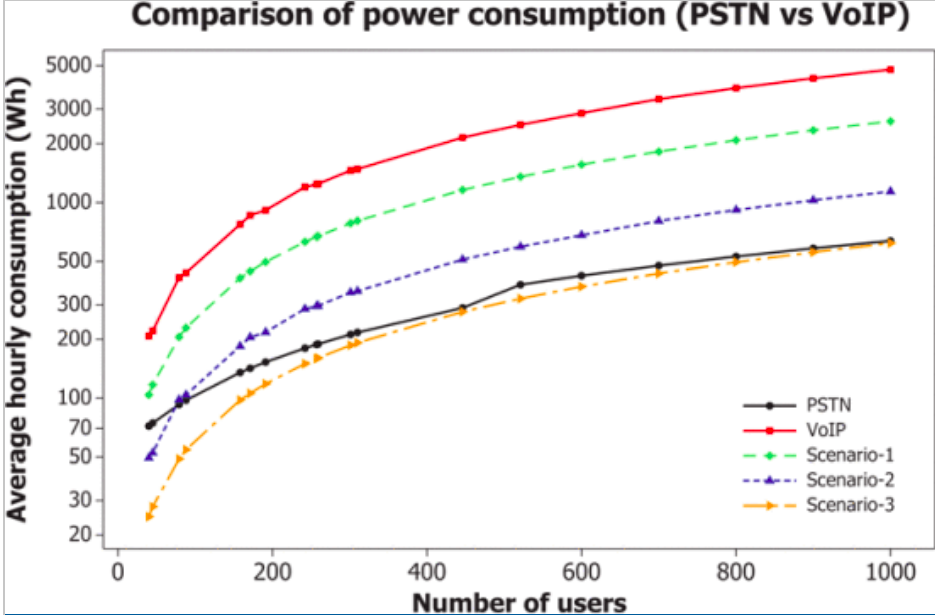
Comparison of energy efficiency in PSTN and VoIP systems [14]
While PSTN and other hybrid scenarios relied on audio only communication the embedded systems involved took great pain to make then energy efficient which is not really the case with all digital and software based VoIP.
Power Consumption
Mobile phone : Typical smartphone with 4,000mAh ( 4 Ah) battery that gets 1 full cycle of usage a day. Daily consumption =4Ah*3.7V=14.8 Wh
Laptop : With 14–15″ screen, a laptop can draw 60 watts power in active use depending on model. Runing 8 hours a day can be 60 * 8 = 480 Wh ( 0.480 kWh) energy consumed in a day.
Desktop PC : Runing at 50-60 Hz frequency , can upto draw 200 W power in active use. For 8 hours energy usage 200 * 8 = 1600 Wh ( 1.6 kWh ) energy a day.
Server : Even though servers are virtual to the request maker , they caters to the request on the other end of the internet.
| Server | Purpose | Server CPU consumption | Clients | Client CPU consumption |
| Application | Hosts an application, which can be run through a web browser or customized client software. | medium | Any network device with access. | low |
| Computing | Makes available CPU and memory to the client. This type of server might be a supercomputer or mainframe. | high | Any networked computer that requires more CPU power and RAM to complete an activity. | medium |
| Database | Maintains and provides access to any database. | low | Any form of software that requires access to structured data. | low |
| File | Makes available shared files and folders across a network. | medium | Any client that needs access to shared resources. | low |
| Game | Provisions a multiplayer game environment. | high | Personal computers, tablets, smartphones, or game consoles. | high |
| Hosts your email and makes it available across the network. | medium | User of email applications. | low | |
| Media | Enables media streaming of digital video or audio over a network. | high | Web and mobile applications. | high |
| Shares printers over a network. | low | Any device that needs to print. | low | |
| Web | Hosts webpages either on the internet or on private internal networks. | medium | Any device with a browser. | medium |
Typically runing on 850 Wh ( 0.850 kwh ) of energy in an hour and since server are usually up 24*7 that totals to
0.850 * 24 = 20.4 kWh a day [2].
VoIP System ( 7 VM’s) : For a setup of 7 VM’s ( could on a the same PM), total energy consumed in a day
20.4 * 7 = 142.8 kWh.
Data centre: The data centre building consists of the infrastructure to support the servers, disks and networking equipment it contains. However, for simplicity, I will only use the consumption of servers and ignore the cooling units, networking, backup batteries charging, generators, lightning, fire suppression, maintenance etc.
High tier DC can have 100 Megawatts of capacity having each rack was using 25 kW of power in a 52U Rack. 100,000 kW / 25 kW = 4,000 racks * 52(U) = 208000 1U servers. This number scales down depending on how much energy each server uses and idle servers.
Total energy 100,000 kW * 24 hours = 2400000 kWh
Carbon Footprint
Carbon footprint in the context of this article refers to the amount of greenhouse gas ( consisting majorly of Co2) caused by electricity consumption. The unit is carbon emission equivalent of the total amount of electricity consumed kg CO2 per kWh.
In doing this calculation I have assumed 0.233 kg CO2 per kWh which could be less or more depending on the generation profile of the electricity provider as well as the heat produced by the machine.
Laptop: Aside from the production which could be 61.4 kg (135.5 lbs) of Co2, a 60W laptop will produce 0.112 kg co2 eq per day.
Desktop PC: Aside from production cost and heating, the GWG and co2 eq emission from running a desktop for a day ( 8 hours) produces 1.6* 0.233 = 0.3728 kg CO2 per kWh
Server : 20.4 * 0.233 = 4.7532 kg CO2 per kWh per day .
VoIP System ( 7 VM’s): Again ignoring the GWG emission of associated components, 142.8 * 0.233 = 33.2724 kg CO2 per kWh per day. It is to be noted that DC’s ( datacentres) use the term PUE ( Power Usage Effectiveness) to showcase their energy efficiency and energy efficiency certification uses the same in ratings.
Data centre: electrical carbon footprint( approximate calculation not counting the cooling, infra maintenance, lightning and possibly idle servers in datacentre) is 2400000 * 0.233 = 559200 kg CO2 per kWh per day

It is to be noted that a common figure should not be extrapolated like this to derive carbon emission. The emission depends on the fuel mix of the electricity generation as well as the life cycle assessment (LCA) of carbon equivalent emission. Countries with heavy reliance on renewables have lower co2 footprint per kWh ~ 0.013 kg co2 per kWh Sweden while others may have higher such as 0.819 kg CO2 per kWh Estonia [1].
Flatten the Curve from Tech and Internet usage
Rack servers tend to be the main perpetrators of wasting energy and represent the largest portion of the IT
energy load in a typical data center.
A decade ago, small enterprise IT facilities were quick to create data centres for hosting applications from hospitals, banks, insurance companies. While some of these is likely to have been upgrade to shared server instances runing on IaaS providers, most of them are still serving traffic or stays there for the lack of effort to upgrade.
With the advancement in p2p technlogies such as dApps , bitcoion network , p2p webrtc streaming , more edge computed ML continue to create disruptions in existing trend , most likely to result in in many fold increase in consumption.
According to the Cambridge Center for Alternative Finance (CCAF), Bitcoin currently consumes around 110 Terawatt Hours per year — 0.55% of global electricity production
Harward Business Review [12]
“the emissions generated by watching 30 minutes of Netflix (1.6 kg of CO2) is the same as driving almost four miles.”
EnergyInnovation [13]
Cloud Computing and Energy efficiency
Cloud computing ( SaaS, PaaS , IaaS and also CPaaS) minimize power consumption and consequently IT costs via virtualization, clustering and dynamic configuration.
With cloud infrastrcture vendors such as Amazon , Google , microsoft .. and their adoption of energy efficiency computing and credible transparency has alleviated some of the stress that could have been made if onsite self – hosted data centres were used as often in mainstream as a decade ago.
Even as cloud providers gives on -demand access to shared resources in large scale distributed computing , the ease of getting on board has inturn created a surge in cloud hosted online applications consequently high power consumption, more operation costs and higher CO2 emissions.
Components of energy Consumption in Data Centre


As shown CPU, Memory, and Storage incur 45% of the costs and consume 26% of the total energy , however power distribution and colling cost 25% but consumer >50% of total energy.
Energy forcast for Data Centres
As reported by nature [3] the widely cited forcasts suggested thte total electrcity demand of ICT ( Informatioin and Communication technology ) will accelerate and while consumer devices such as smart TV , laptops and mobile are becoming energy effcient , the data centres and network devices will demand bigger portions. Reported in 2018 , 200 Twh( terawatt hours) of energy was being consumed by data centers . Although there are no figures for the telecom or specifically IP cloud telephony , the assumption that enormous multimedia data flows in every session is enouogh to assume the figure must be huge.
Energy eficiency in data centres have also been the subject of many papers and studies. Many of the tech advancements and measures have so far been able to keep the growth in energy requirnments by tech sector to a linear/ flat one.

Some noteworthy innovations made in Data centre for energy efficiency include –
- Star efficiency requirnments
- Average server utilization
- Server power scaling at low utilization
- Average power draw of hard disk drives
- Average power draw of network ports
- Average infrastructure efficiency (i.e., PUE)
PUE = Total Facility power / IT equipment power
Standard 2.0, Good 1.4 , Better 1.1
Low PUE indicates greater efficicny since more power would then be used by It gear . Idealistically 1 should be the perfect score where all power was used only by the IT gears.
2. Optimizing the cooling system which takes a lot of focus is also not touched upon here but can be understood in great detail from very many sources including one here on how google uses AI for cooling its Datacentres [6]
3. Throttle-down drive ,a device that reduces energy consumption on idle processors, so that when a server is running at its typical 20% utilization it is not drawing full power
Energy efficiency is vital to not only productivity and performance but also to carbon neutral tech and economy. There is ample scope to designing energy efficient applications and platfroms. Some approaches are described below:
Energy Efficiency in VoIP Architecture and design
Low Energy consumption not only lowers operating cost but also helps the enviornment by reducing carbon emission.
1.Server Virtualization
By consolidating multiple independant servers to a single underlying physical server helps retain the logical sepration while also maintaining the energy costs and maximizinng utilization . VM’s( Virtual machines) are instances of virtaulized portions on the same server and can be independetly accesed using its own IP and network settings.
To reduce electricity usage in our labs and data centers, we use smart power distribution units to monitor
Cisco 2020 Environment Technical Review [20]
our lab equipment. We increase server utilization by using virtual machines. Our Cisco Customer
Experience labs use a check-in, check-out system of automation pods to allow lab employees to set up
configurations virtually and then release equipment when they are finished with it.
Models to place VMs on PM ( physical machine ) have been proposed by Dong et al[8] , Huang[9] ,Tian et al [10]
2.Decommissioning old / outdated servers
While this is the most obvious way to increase efficiency , it is also the toughest since legacy applications or a small portion of it may be running on a server that service providers are not keen on updating or updates do not exist and it is past end of life yet somehow still in use. It is important to identify such components. Check if maybe an old glassfish or bea weblogic SIP servlet server needs updating and/or migration !
3.Plan HA ( high availability ) efficiently
Redundant servers take only if at all any , partial loads so they can be activated in full swing when failover happens in other server. With quick load up times and forward looking monitoring , the analyzers can monitor logs for upcoming failure or predictable downtime and infra script can bring up pre designed containers in seconds if not minutes. It isn’t wise to create more than 1 standby server which does no essential work but consumes as much power.
4.Consolidate individual applications on a Server
Map the maximum precitable load and deduce the percentage comsuption with teh same . In view of these figures it is best to consolidate applications servers to be run on a single server . A distributed microservice based architecture can also support consolidation by runing each major application in its own dockerized container. Consolidation ensures that
- All data can be stored and accessed centrally, which reduces the likelihood of data duplication.
- while a server is drawing full power , it is also showing relataible utilization.
- Single point to prevent intrusion , provide security and fix vulnerabilities against malware like ( ransomware , viruses , spyware , trojans)

5.Reduce redundancy
While it is a common practise to store multiple copies of data such as CDR ( call detail records ) and archiev historical logs for later auditing , it is not the most energy efficient way since it ends up wasting stoarge space. It is infact a better approach to skim only the crtical parts and diacard the rest and definetely implement background tasks to compress the older and less referenced logs.
6.Power management
Powering down idle server or putting unused server to sleep is an effective way to reduce operating power but is often ignored by the IT department in view of risking slower performance and failure in call continuity in case a server does go down. However power management leads to potential energy savings and should be weighted accordingly.
7.Common Storage such as Network Attached Storage
Power consumption is roughly linear to the number of storage modules used. Storage redundancy needs to be
right-sized to avoid rapid consumption of avaible storage space , CPU cycles to refer and index them, its associated power consumption [7].

The process of maximizing storage capacity utilization by drawing from a common pool of shared storage on need baisis also allows for flexixbility.
It is sensible to take the data offline thereby reducing clutter on production system and make the existing data quickly retrievable.
8.Sharing other IT resources
Central Processing Units (CPU), disk drives, and memory optimizes electrical usage. Short term load shifting combined with throttling resources up and down as demand dictates improves long term hardware energy efficiency. [7]
Hardware based approaches such as energy star rating, air conditoning , placement of server racks , air flow , cabling etc have not been touched upon in this article they can be read from energystar report here [5] .
9. DMZ / Perimeter network
The perimeter network (also known as DMZ, demilitarized zone, and screened subnet) is a zone where resources and services accessible from outside the organization are available. Often used as barrier between internal secure green zone within company and outside partners / suppliers such as external organization gateways.
- Load balancers
- API gateways
- SBC ( Session Border controllers)
- Media Gateways
Ways to cut down on CPU consumption in DMZ machines
- Scrutinize incoming traffic only , trust outgoing traffic .
2. Use hardware / network firewalls to monitor and block instead of software defined ones . Hardware firewall can be a standalone physical device or form part of another device on your network. Physical devices like routers, for example, already have a built-in firewall.
Other types of firewalls
- Application-layer firewalls can be a physical appliance, or software-based, like a plug-in or a filter. These types of firewalls target your applications. For example, they could affect how requests for HTTP connections are inspected across each of your applications.
- Packet filtering firewalls scrutinize each data packet as it travels through your network. Based on rules you configure, they decide whether to block the specific packet or not. For example firewalls can block SSH/RDP for remote management.
- Circuit-level firewalls check whether TCP and UDP connections across your network are valid before data is exchanged. For example, this type of firewall might first check whether the source and destination addresses, the user, the time, and date meet certain defined rules.
- Proxy server firewalls secure the traffic into and out of a network by monitor, filter, and cache data requests to and from the network.
Energy Efficiency in VoIP Applications and algorithms
In theory, energy efficient algorithms would take less processing power , run fewer CPU cycles and consume less memory. For the experiments with WebRTC and SIP VoIP systems CPU performance can be reliable factor to consider for carbon emissions . Here is list of approaches to include energy as of the parameters in programing for RTC applications.
- Take advanatge of Multi Core applications
Multi-core processor chips allow simultaneous processing of multiple tasks, which leads to higher efficiency. Same power source and shared cooling leads to better efficiency . It is the same logic which applied to consolidating one power supply for a rach isntead of individual power supply to each servers on rack.
2. Reduce Buffering
Input/Output buffer pile up comuted packets or blocks which will come inot use in near future but may be discarded all together in event of skip or shutdown. For example in case of video on Demand ( VoD) , a buffered video of 1 hour is of not much use if viewer decides to cancel the video session after 10 minutes .
3. Optimize memeory access algorithms
4. Network energy Management to vary as per demand
The newer generations of network equipment pack more throughput per unit of power. There are active energy management measures that can also be applied to reduce energy usage as network demand varies. In a telecoomunication system , almost always a tradeof between power consumption and network performance is made.
- Quick switching of speed of the network to match the amount of data that is currently transmitted. A demand following streaming session will maingtain the QoS , avoid imbalance while also reducing power consumption.
2. Avoid sudden burst and peaks and/or align them with energy availaibility .

Metrics
- computational performance (i.e., computations/second per server),
- electrical efficiency of computations (i.e., computations per kWh),
- storage capacity (i.e., TB per drive), and
- port speeds (i.e., Gb per port)
5. Task Scheduling algorithms
Some recent researched frameworks and models take Co2 emission into prespective , while allocating resources according to queuing model. The most efficient ones not only bring down the carbon footprint but also the high operating cost [11].

Scheduling and monitoring techniques have been applied to achieve a cost effective and power-aware cloud environment by reducing the resource exploitation
6. Centralised operation – RTP topology ( Mesh , MCU and SFU)
Instead of operating many servers at low CPU utilization, at edge of client’s end, combines the processing
power onto fewer servers that operate at higher utilization.
Modern machine learning programs are computationally intensive, and their integration in VoIP systems for tagging , sentiment analysis , voice quality analysis is increasingly adding additional strain already heavy processing of media server in transcoding and multiplexing .

As an example a SFU client sends one upstream but receives 4 downstreams which reduces the load on server but increases on clients .
7. Distributing workload based on server performance
Aggregating tasks and runing them as Serverless , asynchronous jobs instead of standalone processes is very efficient way to cut down idle runing wastage. Additioally catagorizing server workloads based on server performance can also reduce power consumption by using idle servers efficiently. Thermal aware workload distribution also helps reducing power consumption and consequently electricity consumption in cooling .
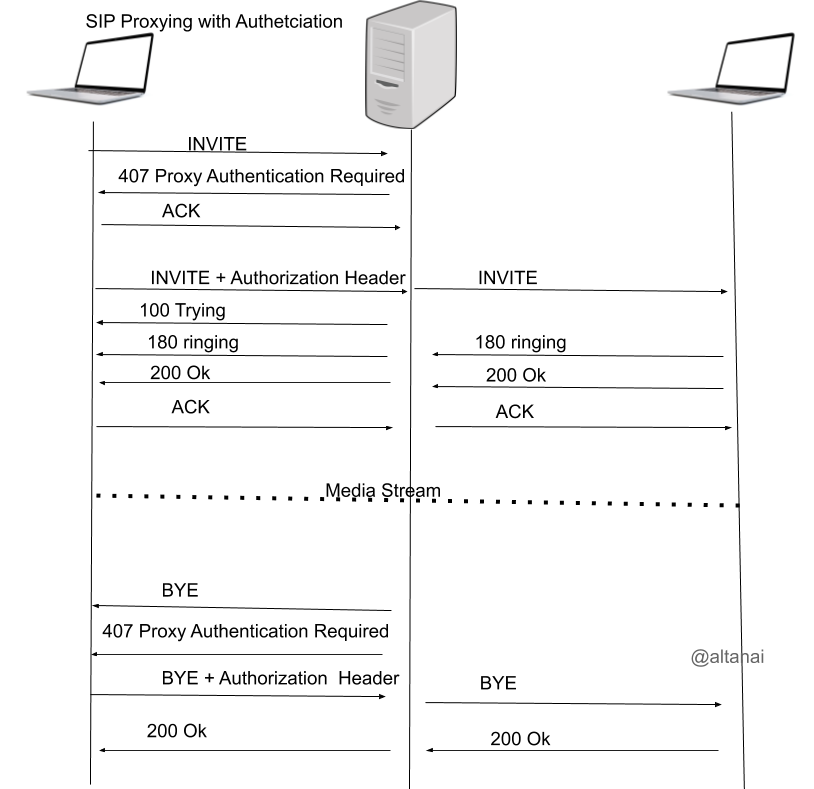
8 . Reduce reauthetication and challemge response mechanism when it can be avoided.
There exists multiple modes to authenticate and authorize users and application access to server content
Over the network
- password based auth ,
- third party based auth ( Oauth)
- 2 factors authetication( phone/sms based) ,
- multi factor auth ( sms / email / other media) ,
- token auth ( custom USB device/ smart card ) ,
- biometric auth (physical human charecteristics / scanners ) ,
- transactional auth ( location , hour of day , browser/ machine type)
Computer recognition authentication
- CAPTCHA
- Single sign-on
Authentication protocols
- Kerbos – Key Distribution Center (KDC) using a Ticker gransting Server ( TGS)
- TLS/SSL
A callflow involves AAA while creating the session and may require occsional re authetication to reafform the user is intended one. Doing re-authtication too often increases the power consumption and can be countered by caching and timeout mechanism.
Point of presence and handover using Carbon footprint in different demographics
- Include Carbon emission from Datacentre in condieration before engaging the server in call path from load balancer gateway

2. Use point of presence ( PoP) for server according to their carbon emission factor in the demography .


Energy Efficiency in WebRTC browser applications and native applications
In a Video conferencing the over browser, WebRTC has emerged as te the default standard . The efficiency of sch webrtc browser based video conferencing web applications can be enhanced in the following ways :
1.Use VoIP Push Notifications to Avoid Persistent Connections
2. Voice Activity detection ( Mute the spectators ) and join with video true , audio false for attendeees
Energy efficiency in VoIP phones
If all eligible VoIP phones sold in the United States were ENERGY STAR certified, the energy cost savings would grow to more than $65 million each year and 1.2 billion pounds of annual greenhouse gas emissions would be prevented, equivalent to the emissions from more than 119,000 vehicles.
Energystart [15]
Low-energy-consuming embedded hardware on most phones keep the average consumption low . A analog phone can consume power between 0.07 W to 9.27 W while a VoIP phone can consume 0.1W to 3.5 W of standby power.


Off mode power is often less than standby power since phone is on low power model during idle hours such as night . According to energy star Sund transmission mechnism also plays a key role and hybrid phones consume more power.

Power allowance ![]() for each of the below features of the device:
for each of the below features of the device:
- 1.0 watt for Gigabit Ethernet
- 0.2 watt for Energy Efficiency Ethernet 802.3az compliant Gigabit Ethernet
Additional proxy incentive(W) for the ability to maintain network presence while in a low power mode and intelligently wake when needed
- 0.3 watt for base capability
- 0.5 watt for remote wake
Government bodies and groups to track Energy efficiency of Telecom and IP telephony
- Alliance for Telecommunications Industry Solutions (ATIS)
- Telecommunications Energy Efficiency Ratio (TEER)
- measurement method covers all power conversion and power distribution from the front end of the
system to the data wire plug, including application-specific integrated circuits (ASICs). - European Telecommunications Standards Institute (ETSI)
- International Telecommunication Union (ITU)
- U.S. Department of Energy (DOE), Environmental Protection Agency (EPA)
External links
Amazon : https://sustainability.aboutamazon.com/environment/sustainable-operations/carbon-footprint
Cisco : https://www.cisco.com/c/dam/m/en_us/about/csr/esg-hub/_pdf/2020_Environment_Technical_Review.pdf
3CX : https://askozia.com/voip/how-can-i-save-energy-with-green-voip-and-my-ip-pbx/
The purpose of the article is to raise awareness about carbon footprint from application programs to archietcture designs techniques to data centres and commuulative performance. It gives a direction to stakeholders (customers , programmers , architects , mangers , … ) to choose less carbon emitting approach whenever possible since every bit counts to help the environment.
References
[1] rensmart.com https://www.rensmart.com/Calculators/KWH-to-CO2
[2] https://www.zdnet.com/article/toolkit-calculate-datacenter-server-power-usage/
[3] nature : https://www.nature.com/articles/d41586-018-06610-y
[4] Center of Expertise for Energy Efficiency in Data Centers at the US Department of Energy’s Lawrence Berkeley National Laboratory in Berkeley, California. https://datacenters.lbl.gov/
[5] energy Star – https://www.energystar.gov/sites/default/files/asset/document/DataCenter-Top12-Brochure-Final.pdf
[7] https://www.energy.gov/sites/default/files/2013/10/f3/eedatacenterbestpractices.pdf
[8] Yin K, Wang S, Wang G, Cai Z, Chen Y. Optimizing deployment of VMs in cloud computing environment. In: Proceedings of the 3rd international conference on computer science and network technology. IEEE; 2013. p. 703–06.
[9] Huang W, Li X, Qian Z. An energy efficient virtual machine placement algorithm with balanced resource utilization. In: Proceedings of the seventh IEEE international conference on innovative mobile and internet services in ubiquitous computing; 2013. p. 313–19.
[10] W. Tian, C.S. Yeo, R. Xue, Y. Zhong Power-aware schedulingof real-time virtual machines in cloud data centers considering fixed processing intervalsProc IEEE, 1 (2012), pp. 269-273
[11] H. Chen, X. Zhu, H. Guo, J. Zhu, X. Qin, J. Wu Towards energy-efficient scheduling for real-time tasks under uncertain Cloud computing environmentJ Syst Softw, 99 (2015), pp. 20-35
[12] https://hbr.org/2021/05/how-much-energy-does-bitcoin-actually-consume
[13] https://energyinnovation.org/2020/03/17/how-much-energy-do-data-centers-really-use/
[14] F. Bota, F. Khuhawar, M. Mellia and M. Meo, “Comparison of energy efficiency in PSTN and VoIP systems,” 2012 Third International Conference on Future Systems: Where Energy, Computing and Communication Meet (e-Energy), 2012, pp. 1-4, doi: 10.1145/2208828.2208834. https://citeseerx.ist.psu.edu/viewdoc/download?doi=10.1.1.720.446&rep=rep1&type=pdf
[15] https://www.energystar.gov/products/office_equipment/voice_over_internet_protocol_voip_phone
[16] egrid summary table 2018 for carbon emission rate in Us states : https://www.epa.gov/sites/default/files/2020-01/documents/egrid2018_summary_tables.pdf
[17] UK greenhourse gas reporting – https://www.gov.uk/government/publications/greenhouse-gas-reporting-conversion-factors-2018
[20] https://www.cisco.com/c/dam/m/en_us/about/csr/esg-hub/_pdf/2020_Environment_Technical_Review.pdf
[21] It’s Not Easy Being Green by Peter Xiang Gao, Andrew R. Curtis, Bernard Wong, S. Keshav
Cheriton School of Computer Sc https://dl.acm.org/doi/pdf/10.1145/2342356.2342398
